Strava Stories


Run
All StoriesRun
‘Running Saved my Life’: Sophie Grace Holmes on Living with Cystic Fibrosis
Sophie Grace Holmes defies Cystic Fibrosis as an ultra-endurance athlete. Here, she shares how living each day to the fullest fuels both her sporting success and her passion for life.

Run
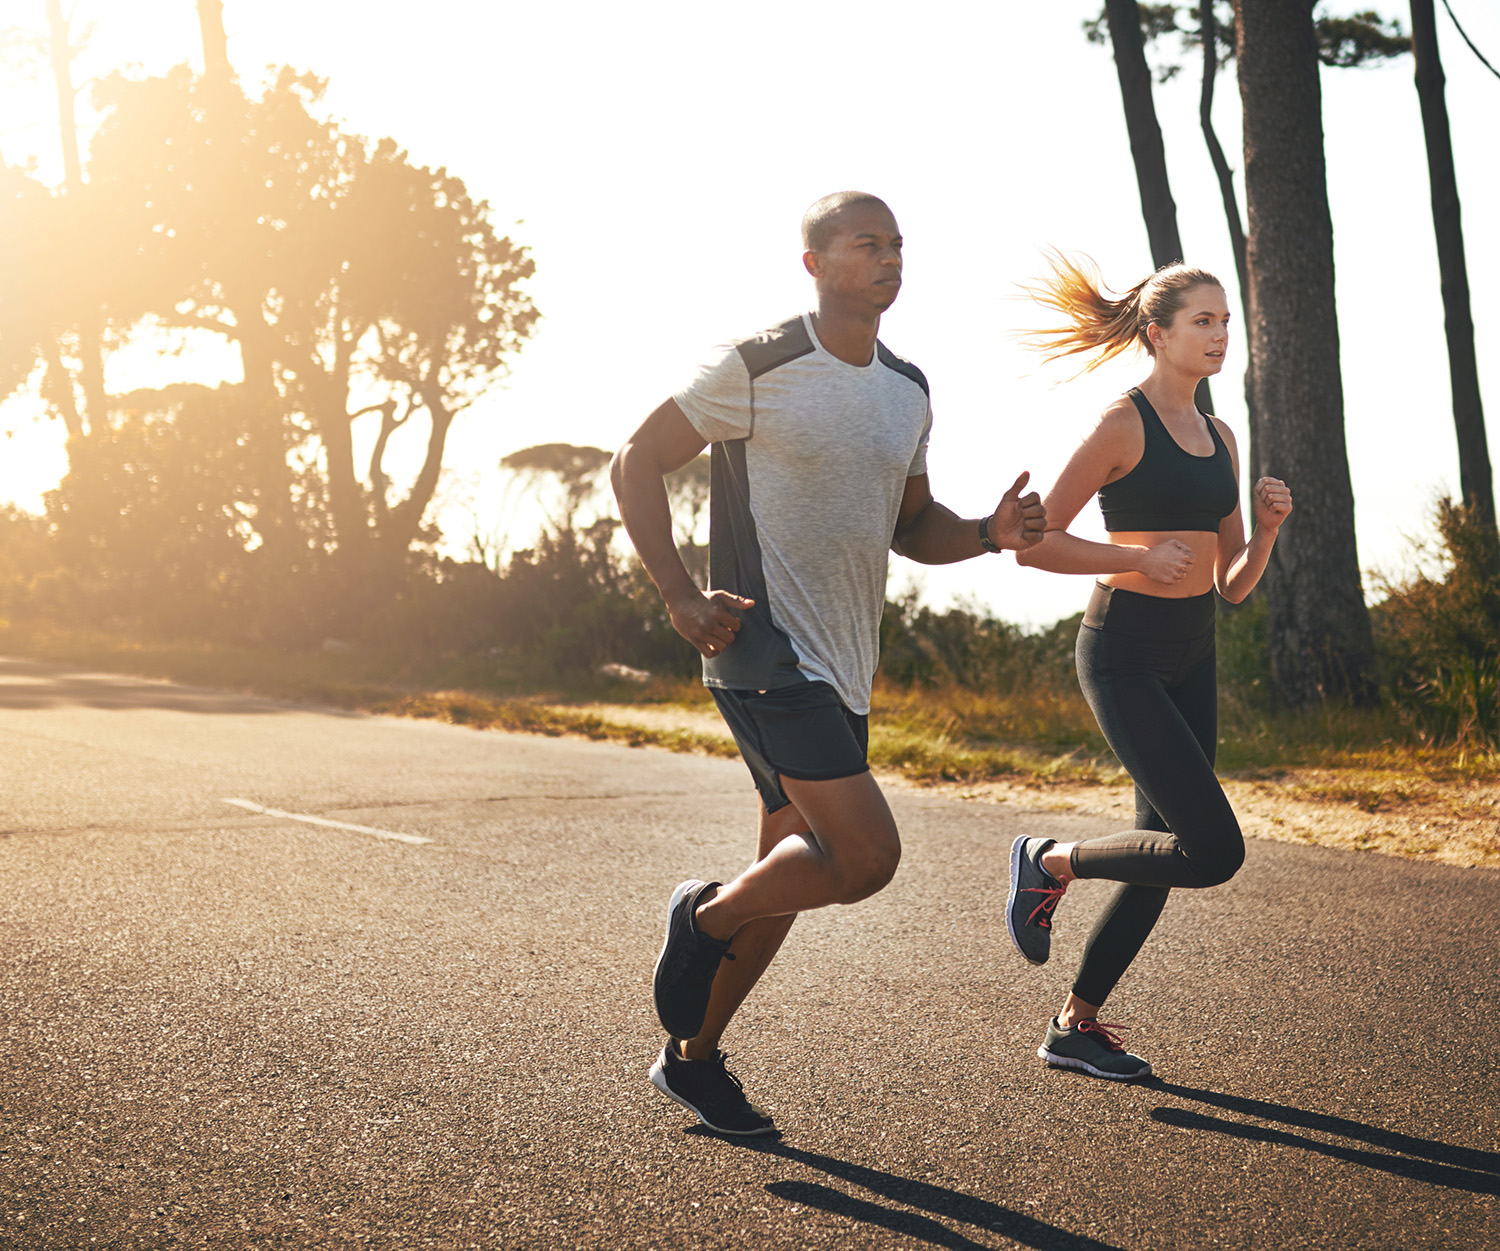
How to Increase Your VO2 Max
VO2 max used to be a niche subject amongst core endurance athletes. However, given its relationship to performance, more and more athletes are looking learning about the subject.
Trail Running
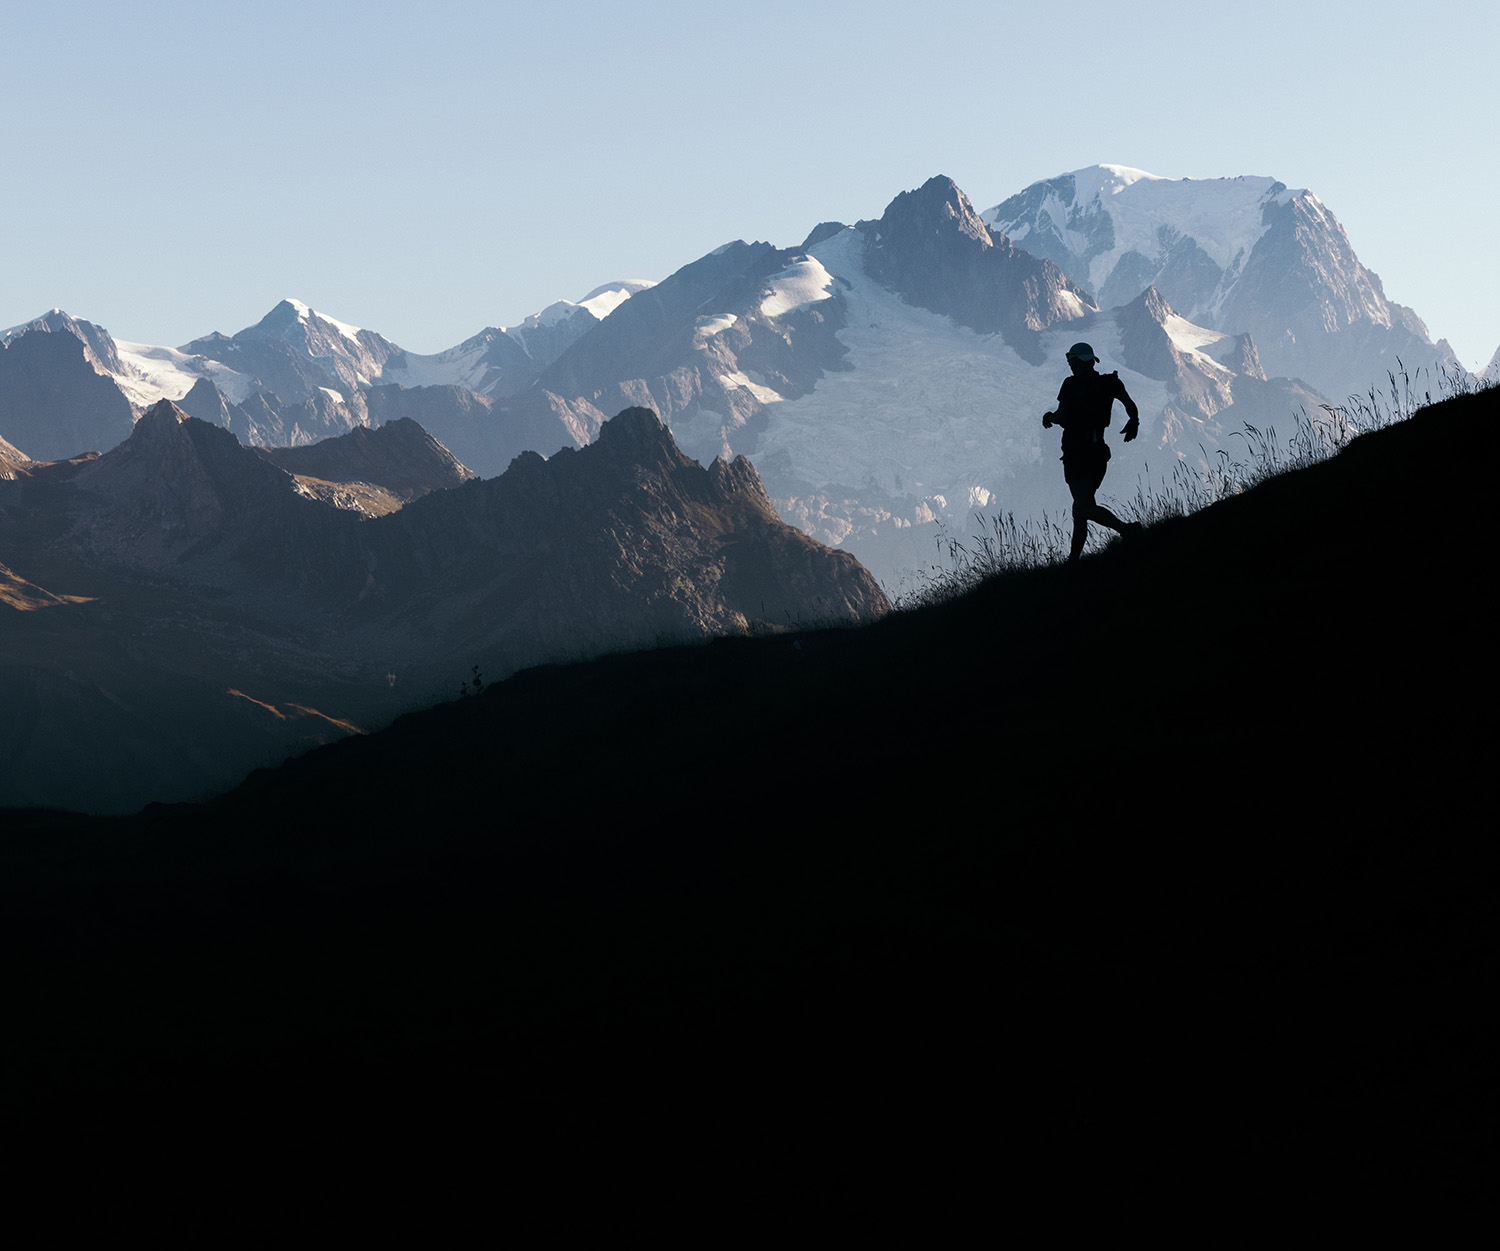
9 Legendary 100-Mile Ultramarathon Races
Running can be an addictive sport. One minute you're tackling your first 5K, the next you're wondering just how far you can go...
Ride
All StoriesRide
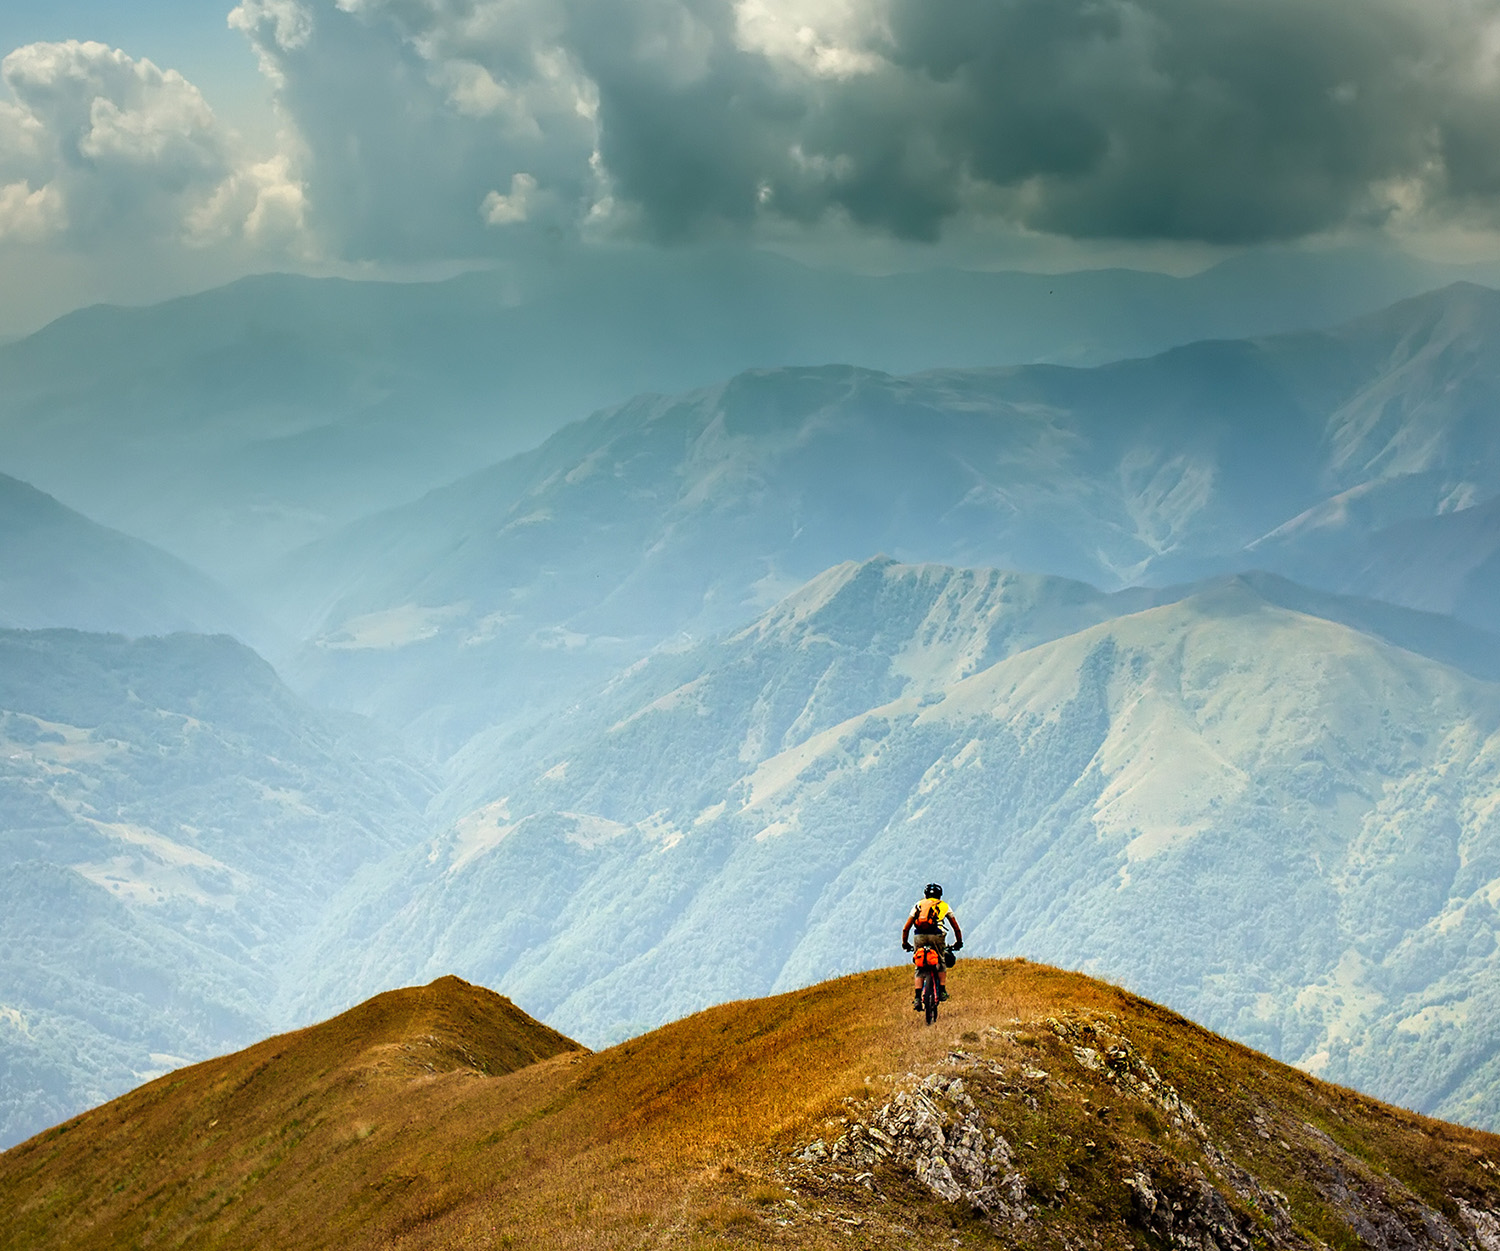
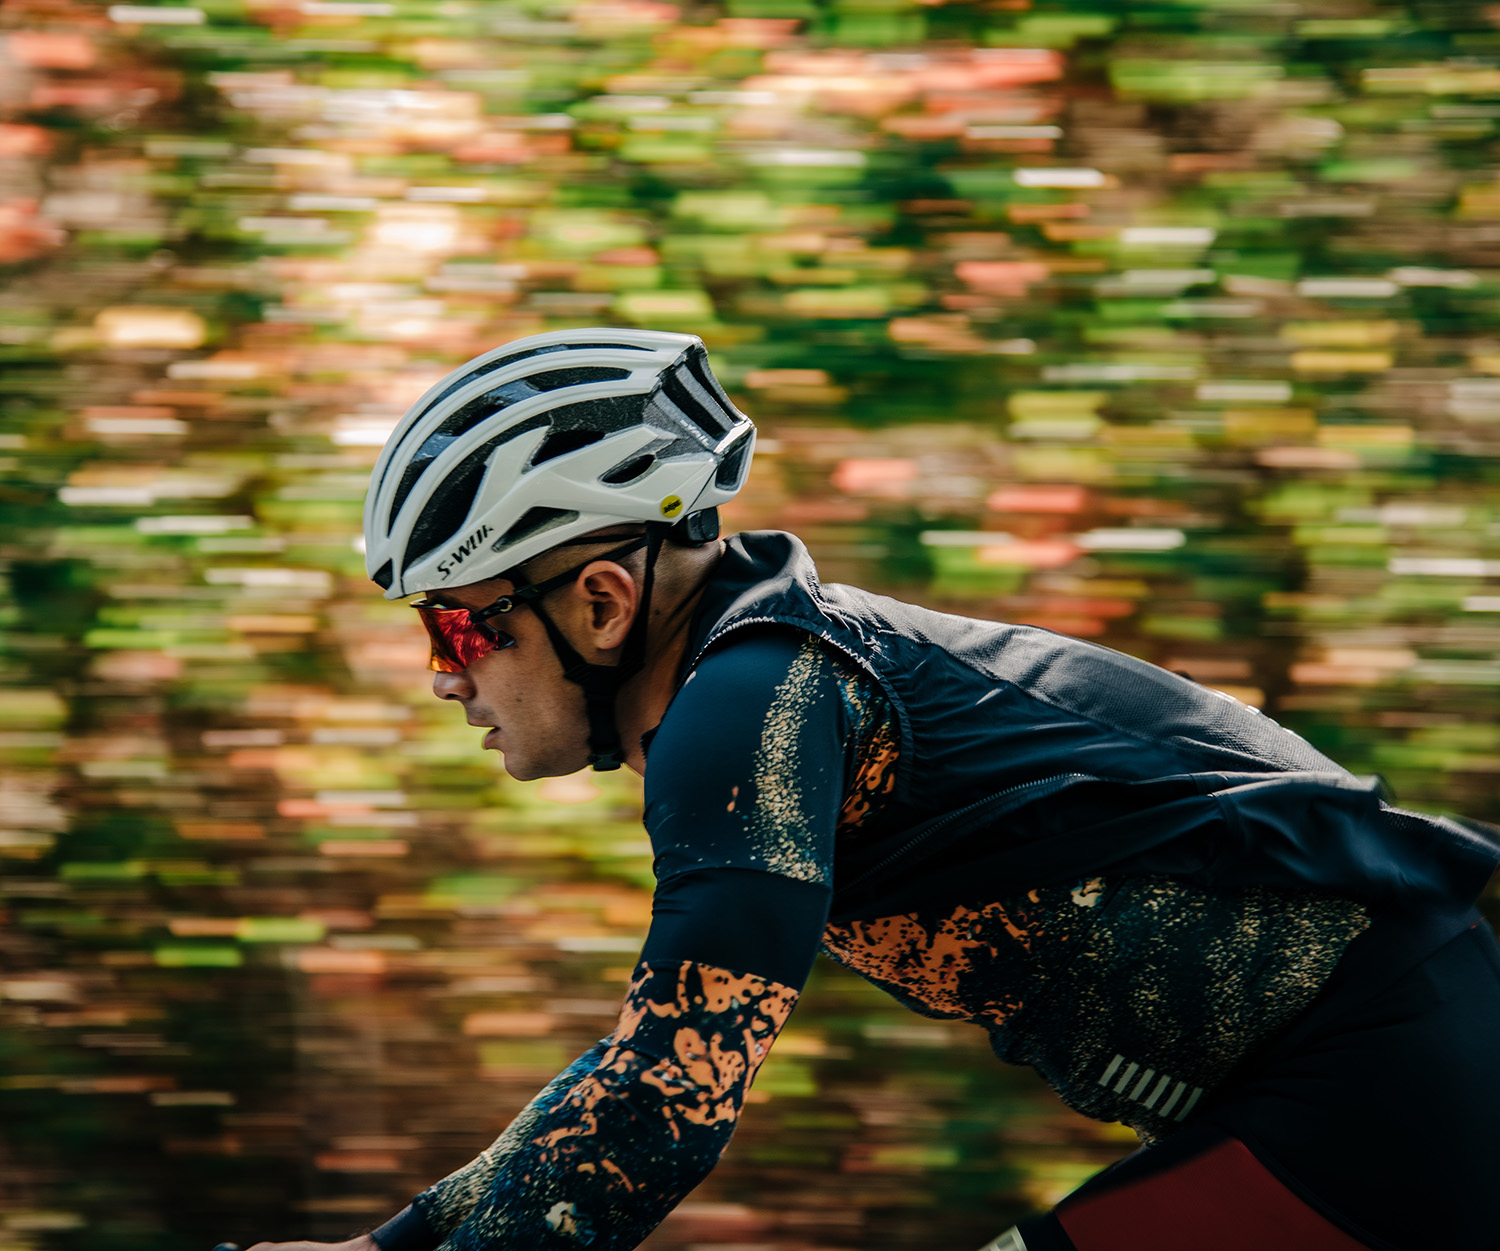
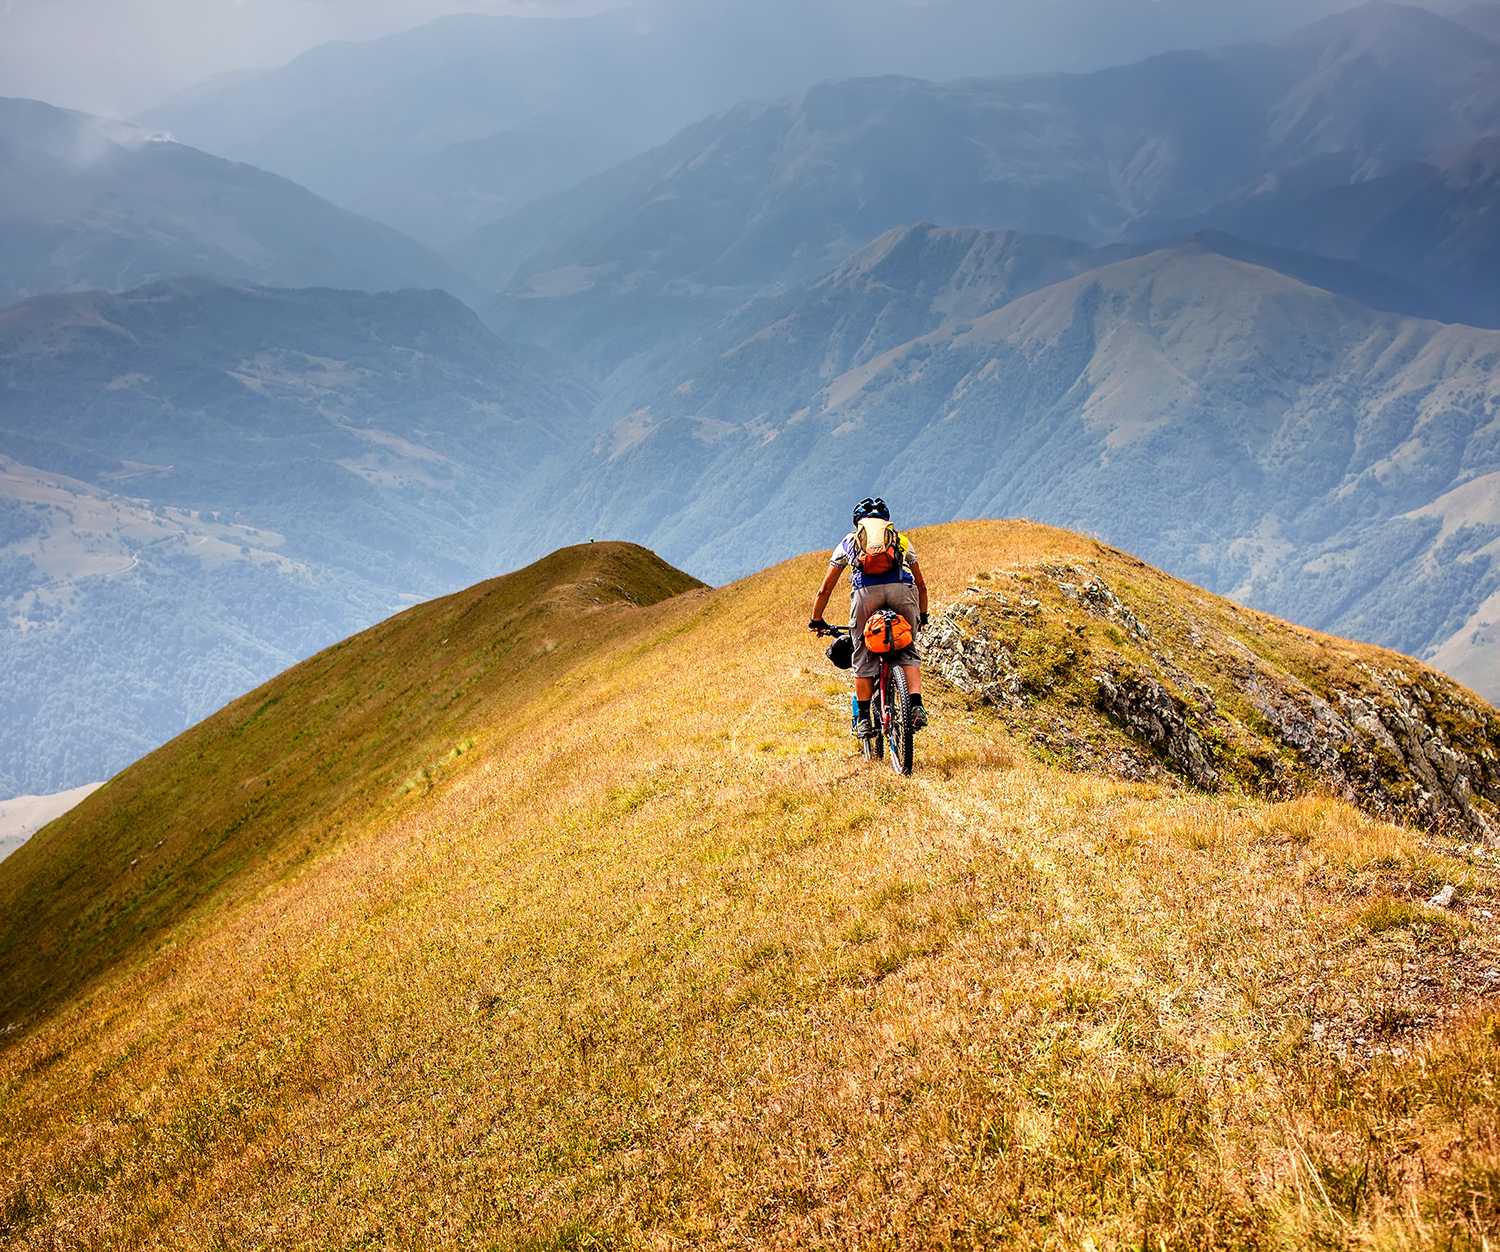
Roadie, MTB… Both?! Don’t Let a Tribal Mindset Limit Your Cycling
Cycling can often be a tribal activity. But if cyclists like roadies and MTBers can put their differences aside, moving between disciplines can have real benefits for everyone who enjoys being on two wheels.

Ride
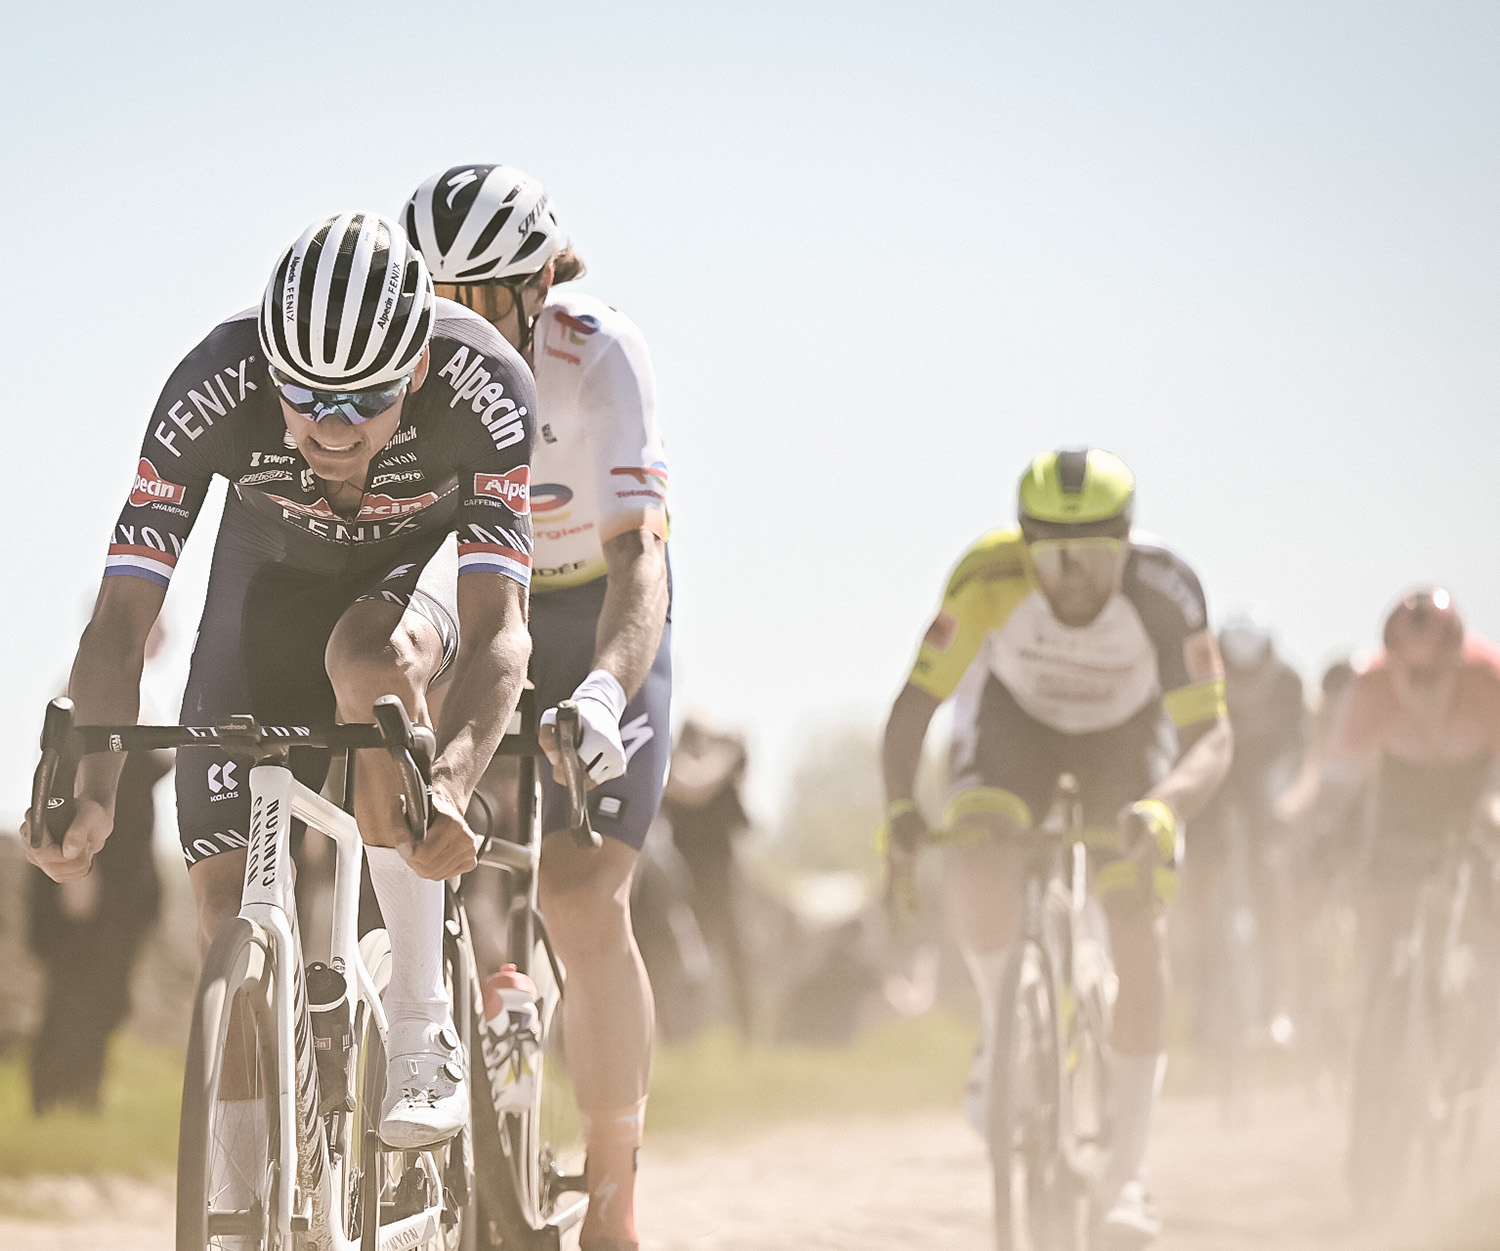
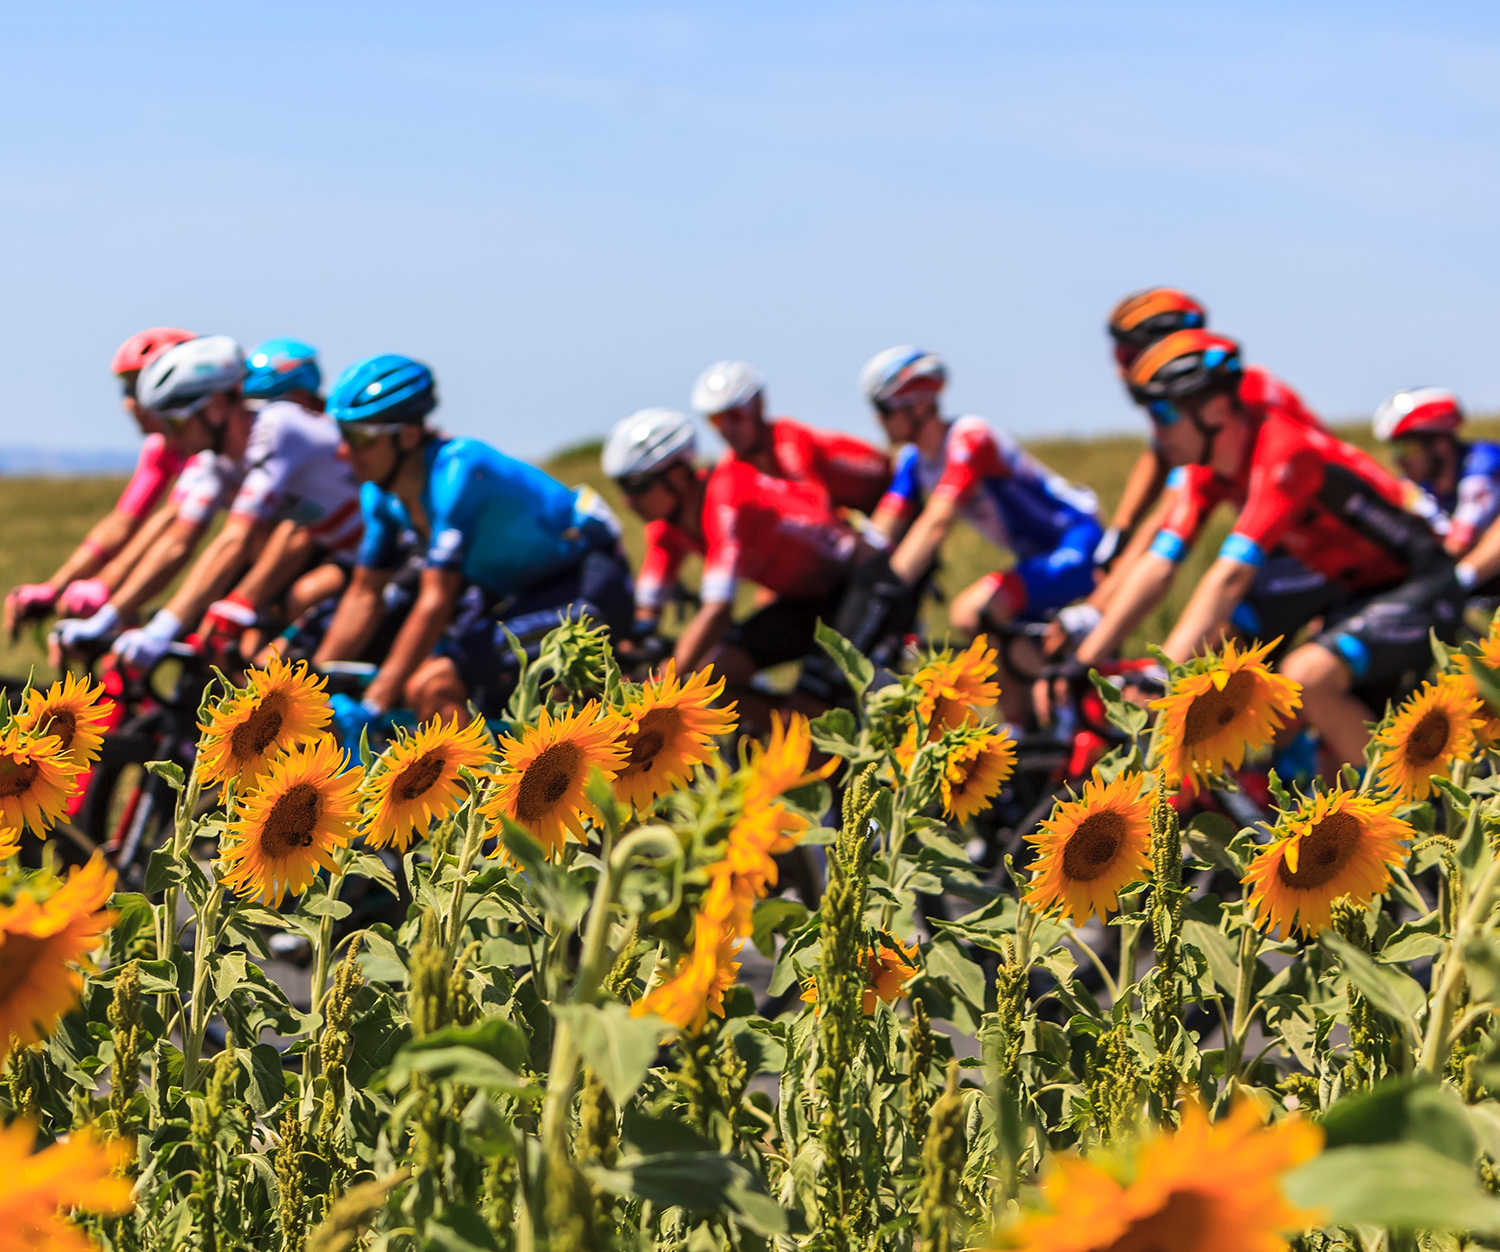
Paris-Roubaix: The Key Strava Segments
The 2024 Paris-Roubaix and Paris-Roubaix Femmes promises to deliver one of the most anticipated races of the Spring. Max Leonard previews the course and the segments that can make or break the riders.

Ride
A Beginner’s Guide to Bikepack Racing
We explore training principles, nutrition strategies, and psychological tools that will help you complete ultra-distance bikepacking events.
From Our Partners
All StoriesSTRAVA | JOIN Cycling

Ride
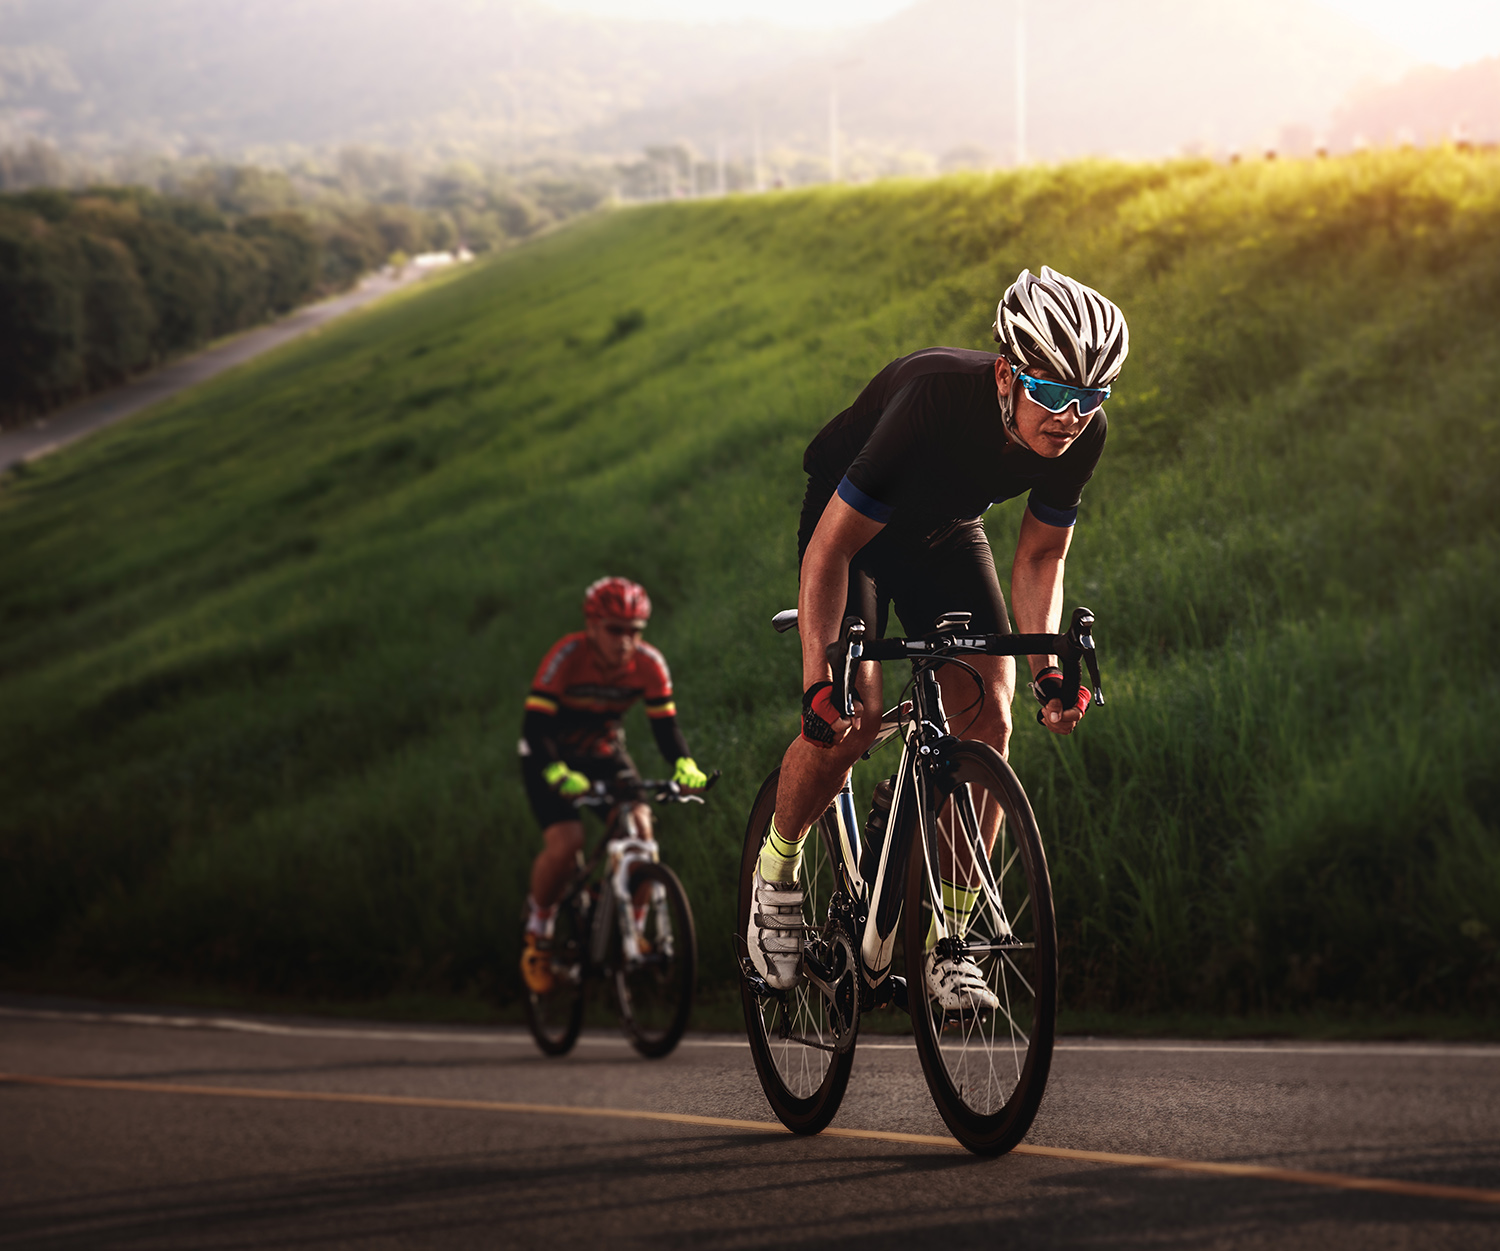
How Pro Cyclists' Lives Have Gotten More Complex in the Last 10 Years
Over the past 10 years, the lives of professional cyclists have gotten dramatically more complex... and that's not always a bad thing, argues Jim van den Berg.
Paid Partnership
STRAVA | Eight Sleep


Multi-Sport
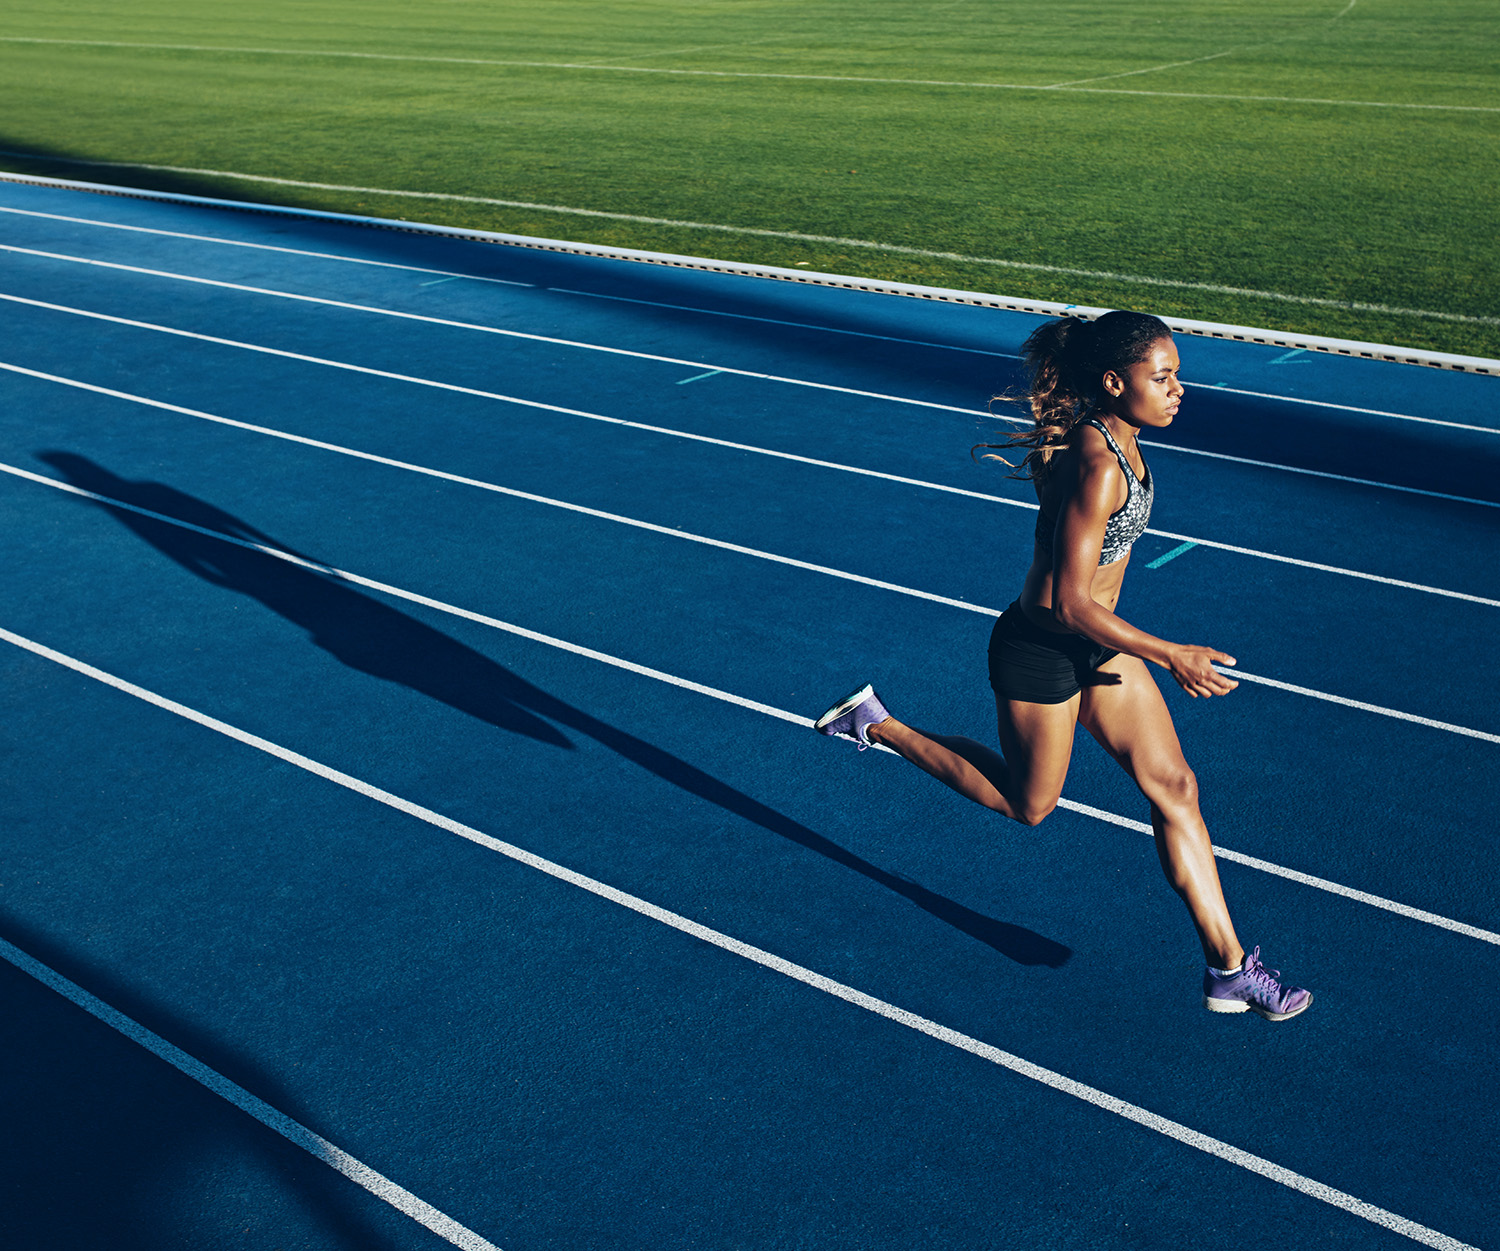
The New Secret Weapon in Sports: Sleep
It's no secret that sleep is a game-changer when it comes to sports performance, but how can you optimize yours?
Paid Partnership
STRAVA | Smartwool

Skiing
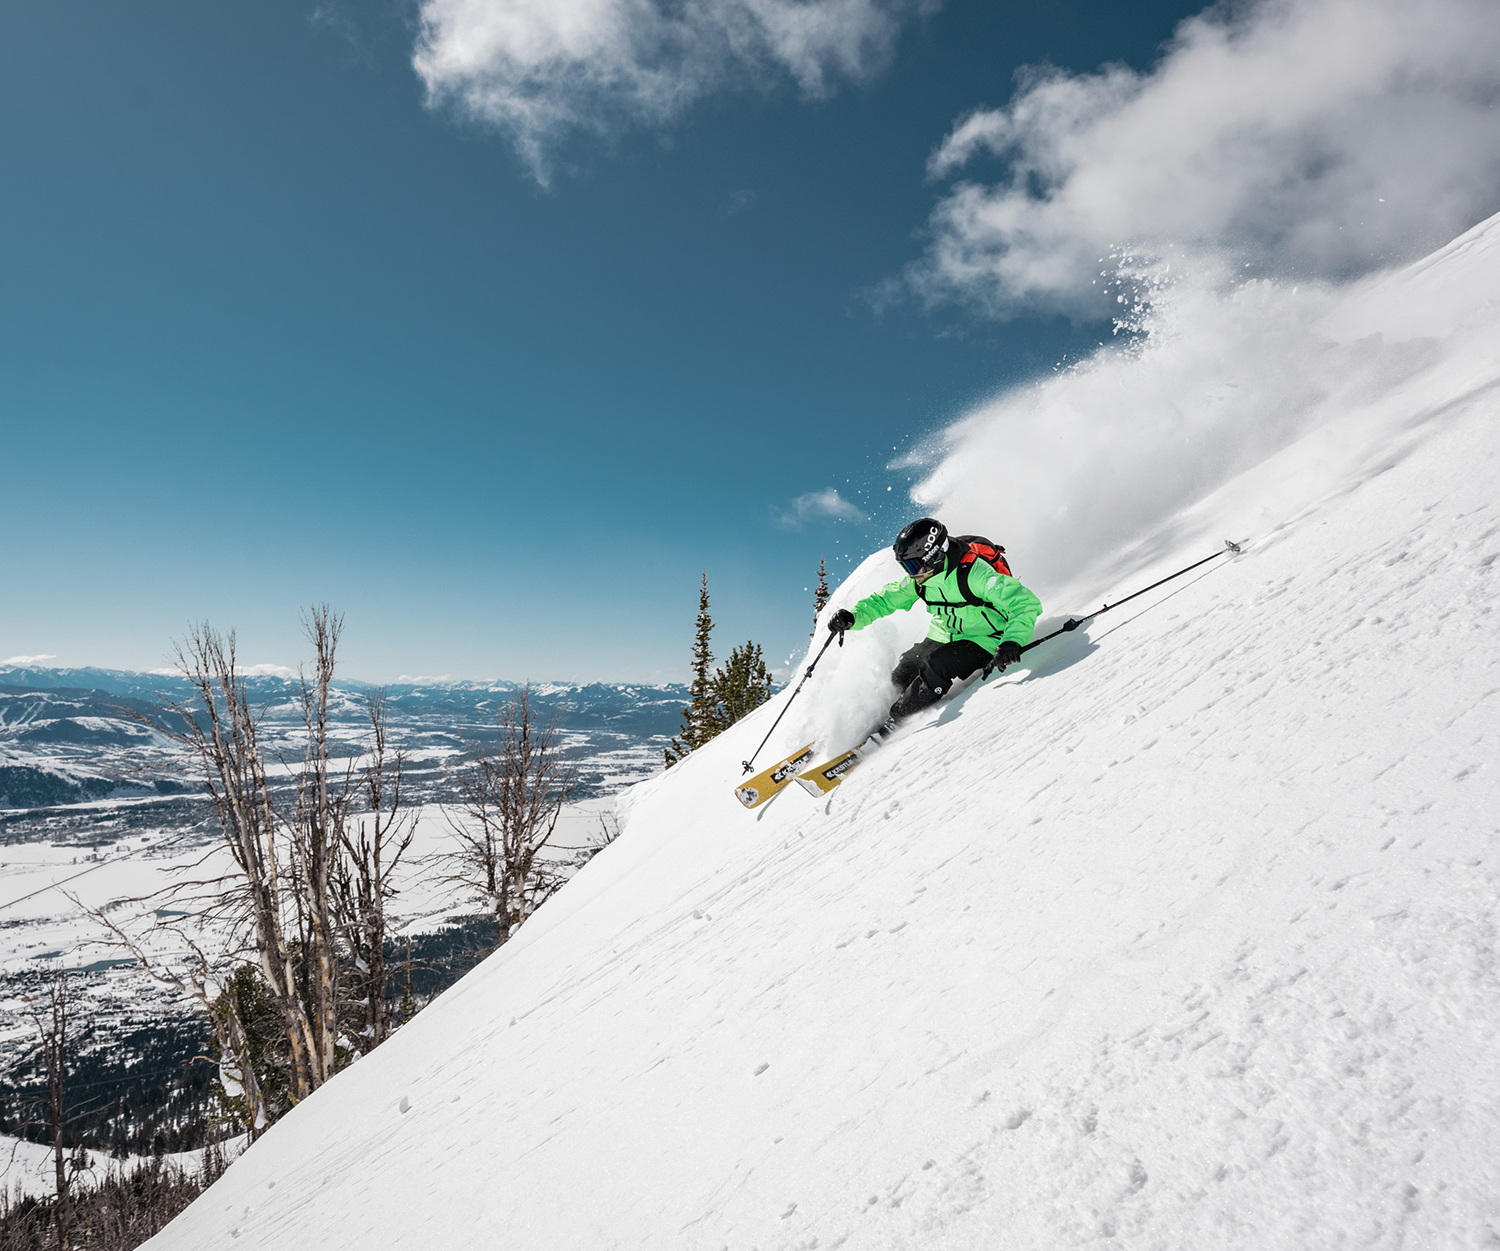
Discovering the Summit Together: Griffin Post Explains The Vital Role of Community in Skiing
No person is an island, especially not in the mountains. Pro skier Griffin Post explores the importance of community, and how epic powder days are always best shared.
Paid Partnership
Training
All Stories

Ride
Segment Hunting? Try These Must-Do Workouts
If you're in the business of segment hunting, there are a few key workouts you should build into your week to help you bag that QOM or KOM.
Run
How to Increase Your VO2 Max
VO2 max used to be a niche subject amongst core endurance athletes. However, given its relationship to performance, more and more athletes are looking learning about the subject.

Ride
Low Risk, High Reward: The Polarized Training Method for Cyclists
Can you make significant performance and fitness gains with just three types of rides? The science says yes.
What's New
All Stories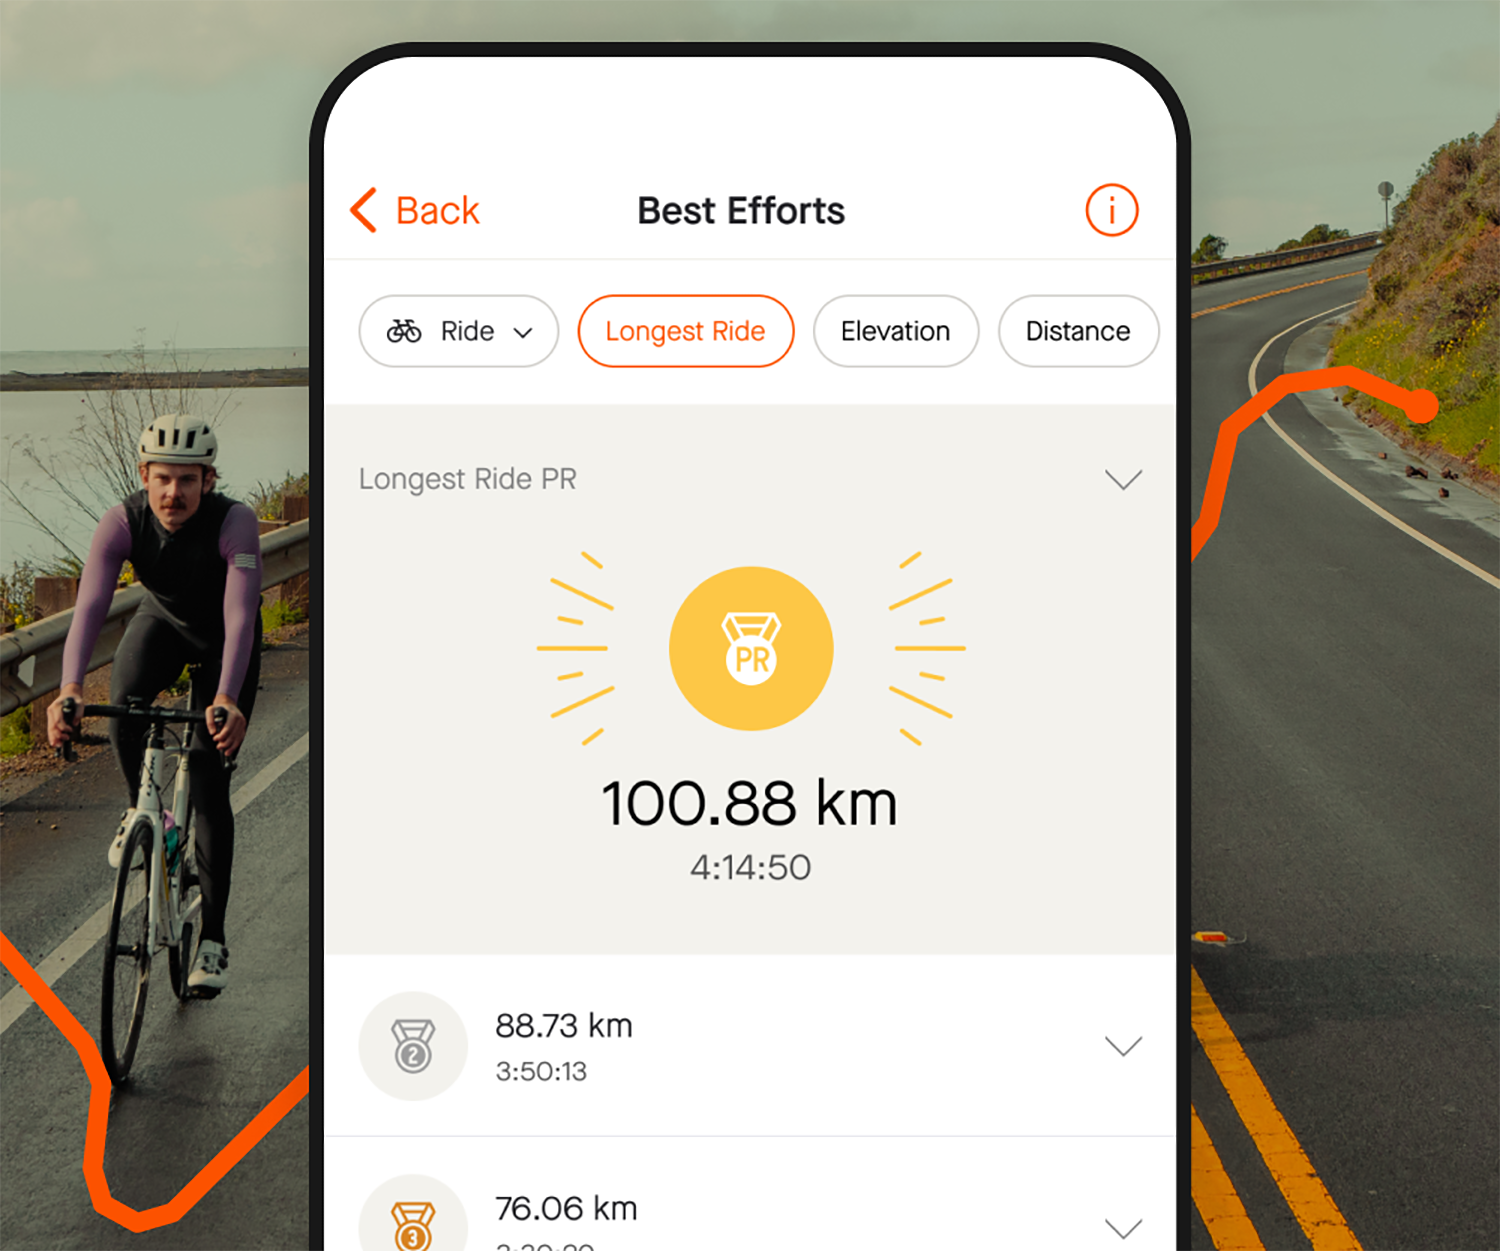

Ride
Just Launched for Cyclists: All-New Best Efforts Categories
77% of cyclists on Strava achieved a PR in 2023 – and 30% got one in the last month. Are you one of them?
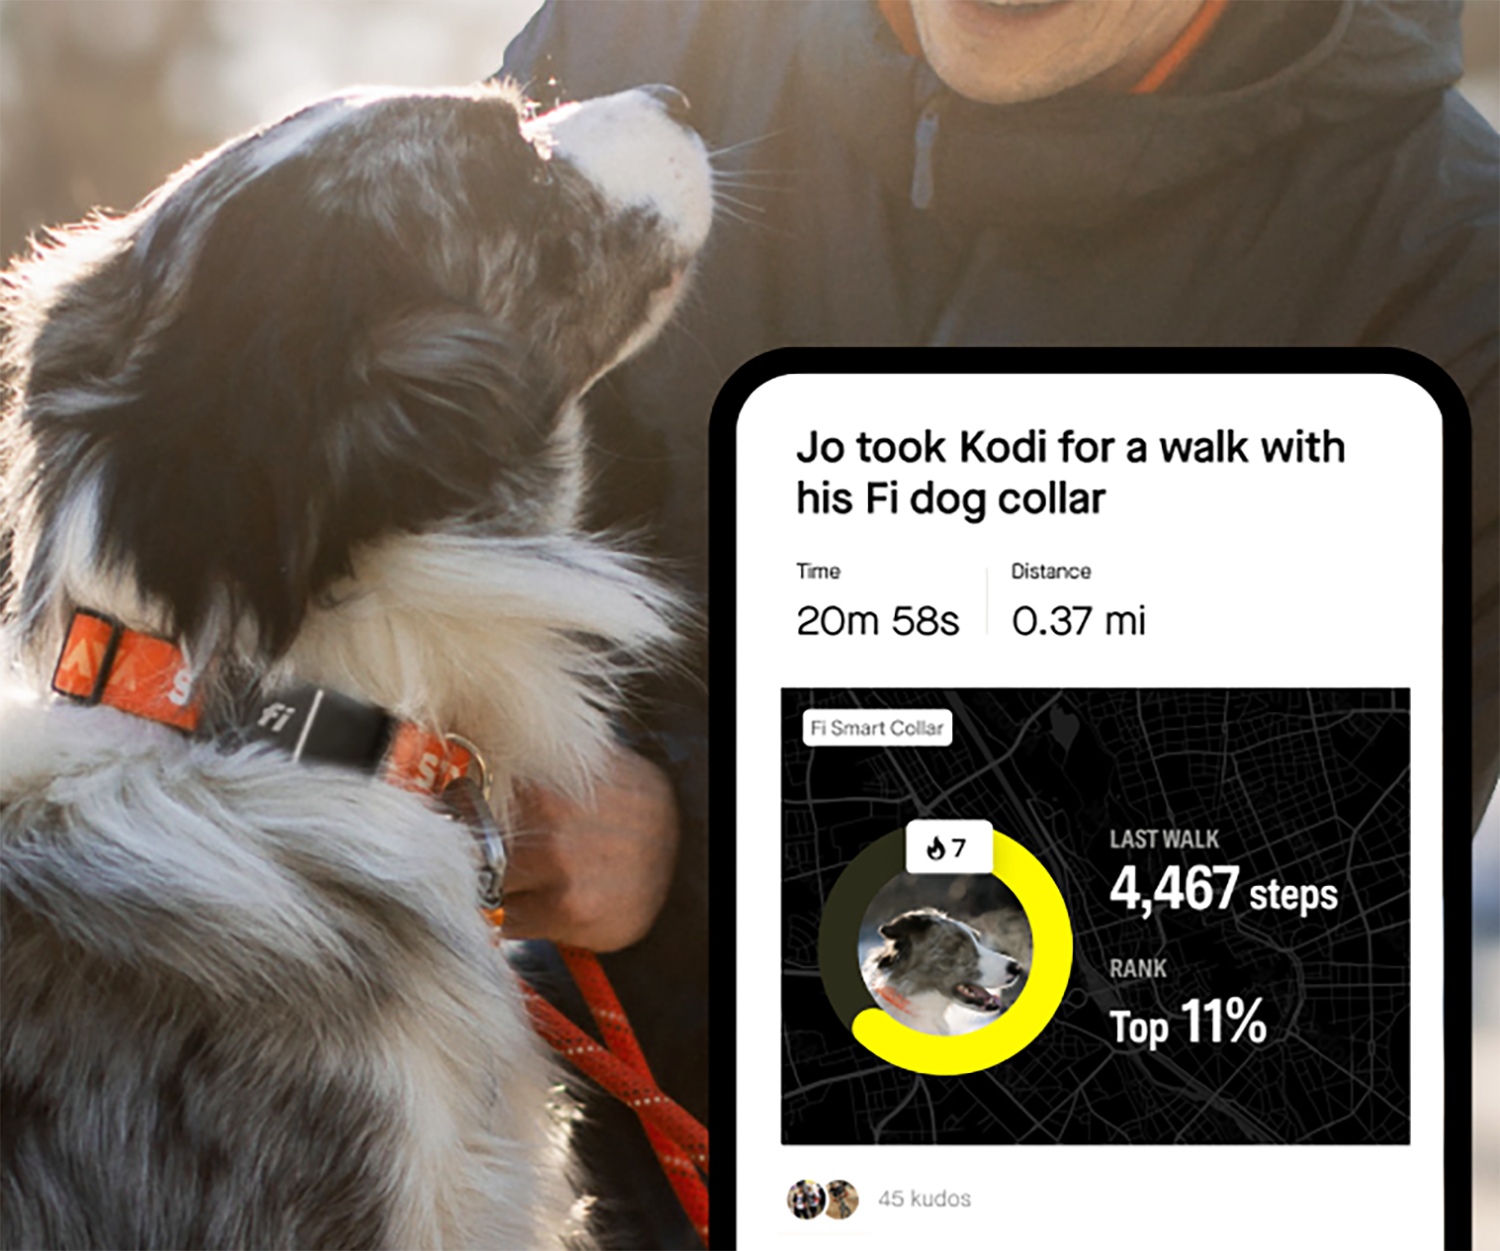

Multi-Sport
Calling all Dog Parents! 🐶
Strava and the Fi Collar are partnering to give you and your furry friend a fun way to stay motivated and moving.
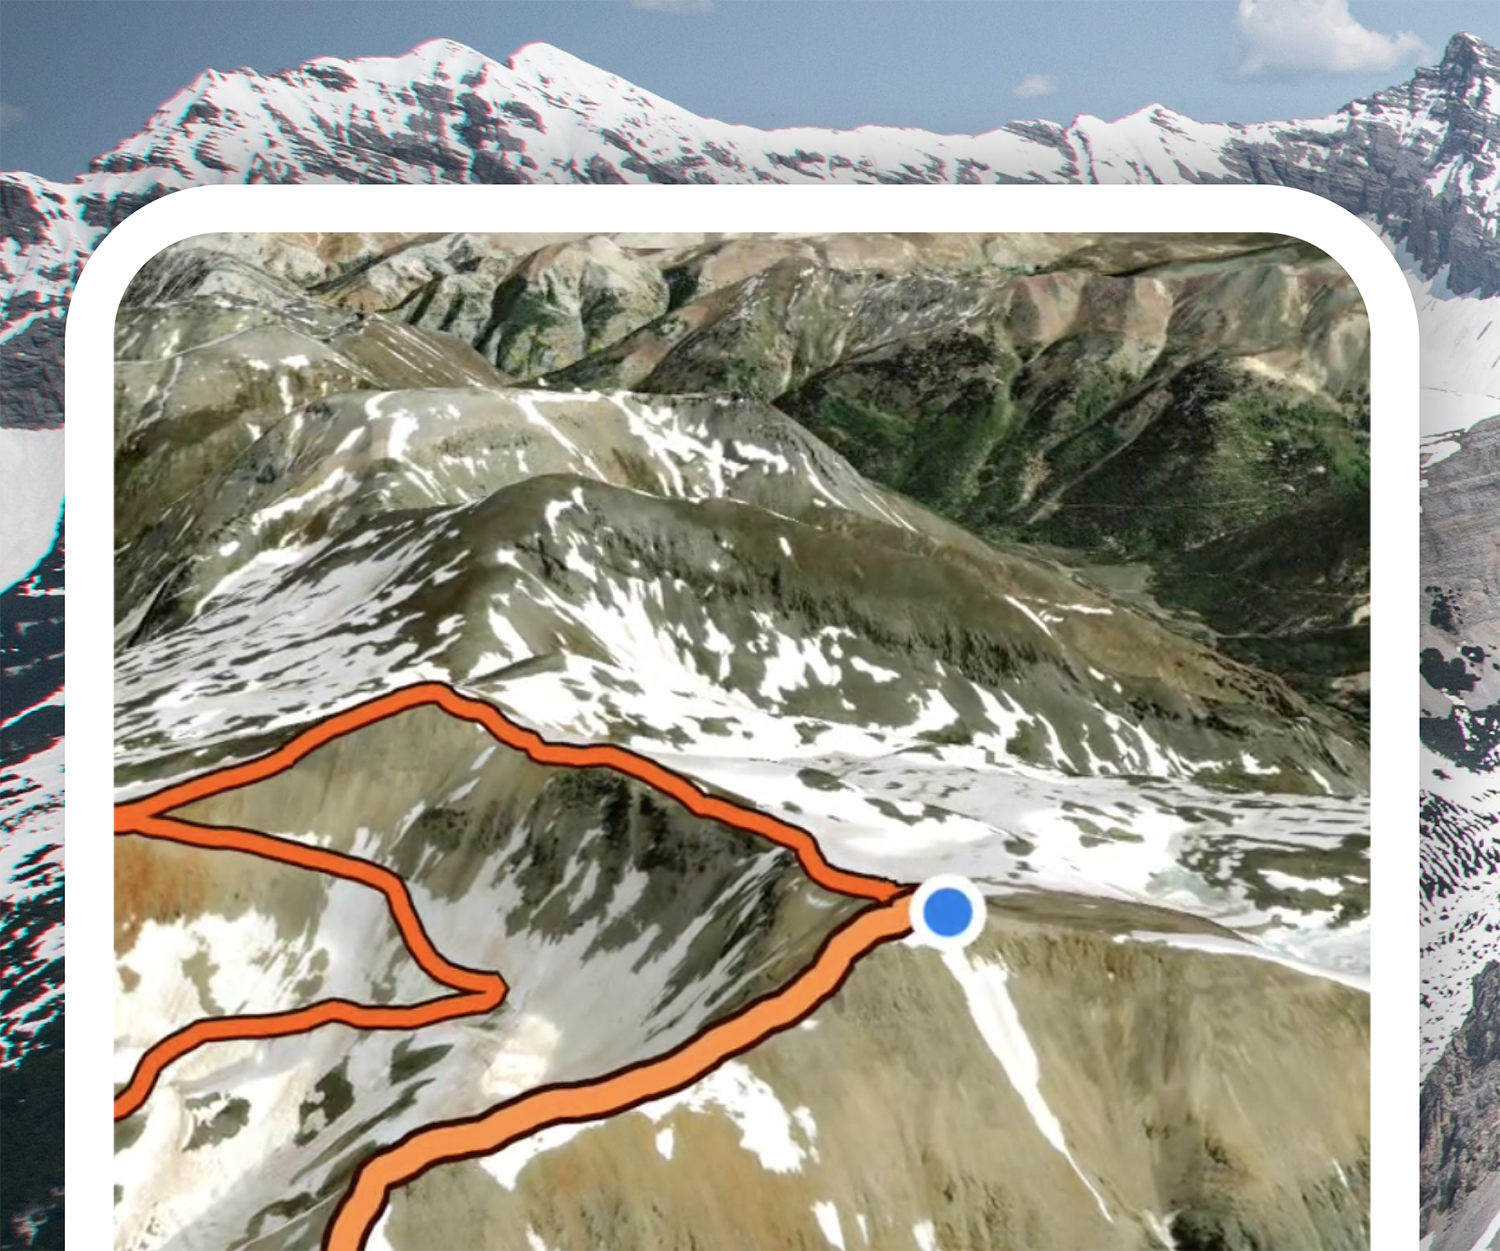

Multi-Sport
Get a Bird’s-Eye View With Flyover
Capture every mile, every switchback, and every climb with Strava's all-new Flyover feature.
Latest Stories
Ride
Adventures of a Lifetime: The World’s Most Challenging Off-Road Bikepacking Races
The number of grueling multi-day off-road races has skyrocketed in recent years. We highlight some of the most adventurous, most challenging events in the world.
Run
‘Running Saved my Life’: Sophie Grace Holmes on Living with Cystic Fibrosis
Sophie Grace Holmes defies Cystic Fibrosis as an ultra-endurance athlete. Here, she shares how living each day to the fullest fuels both her sporting success and her passion for life.
Trail Running
9 Legendary 100-Mile Ultramarathon Races
Running can be an addictive sport. One minute you're tackling your first 5K, the next you're wondering just how far you can go...
Run
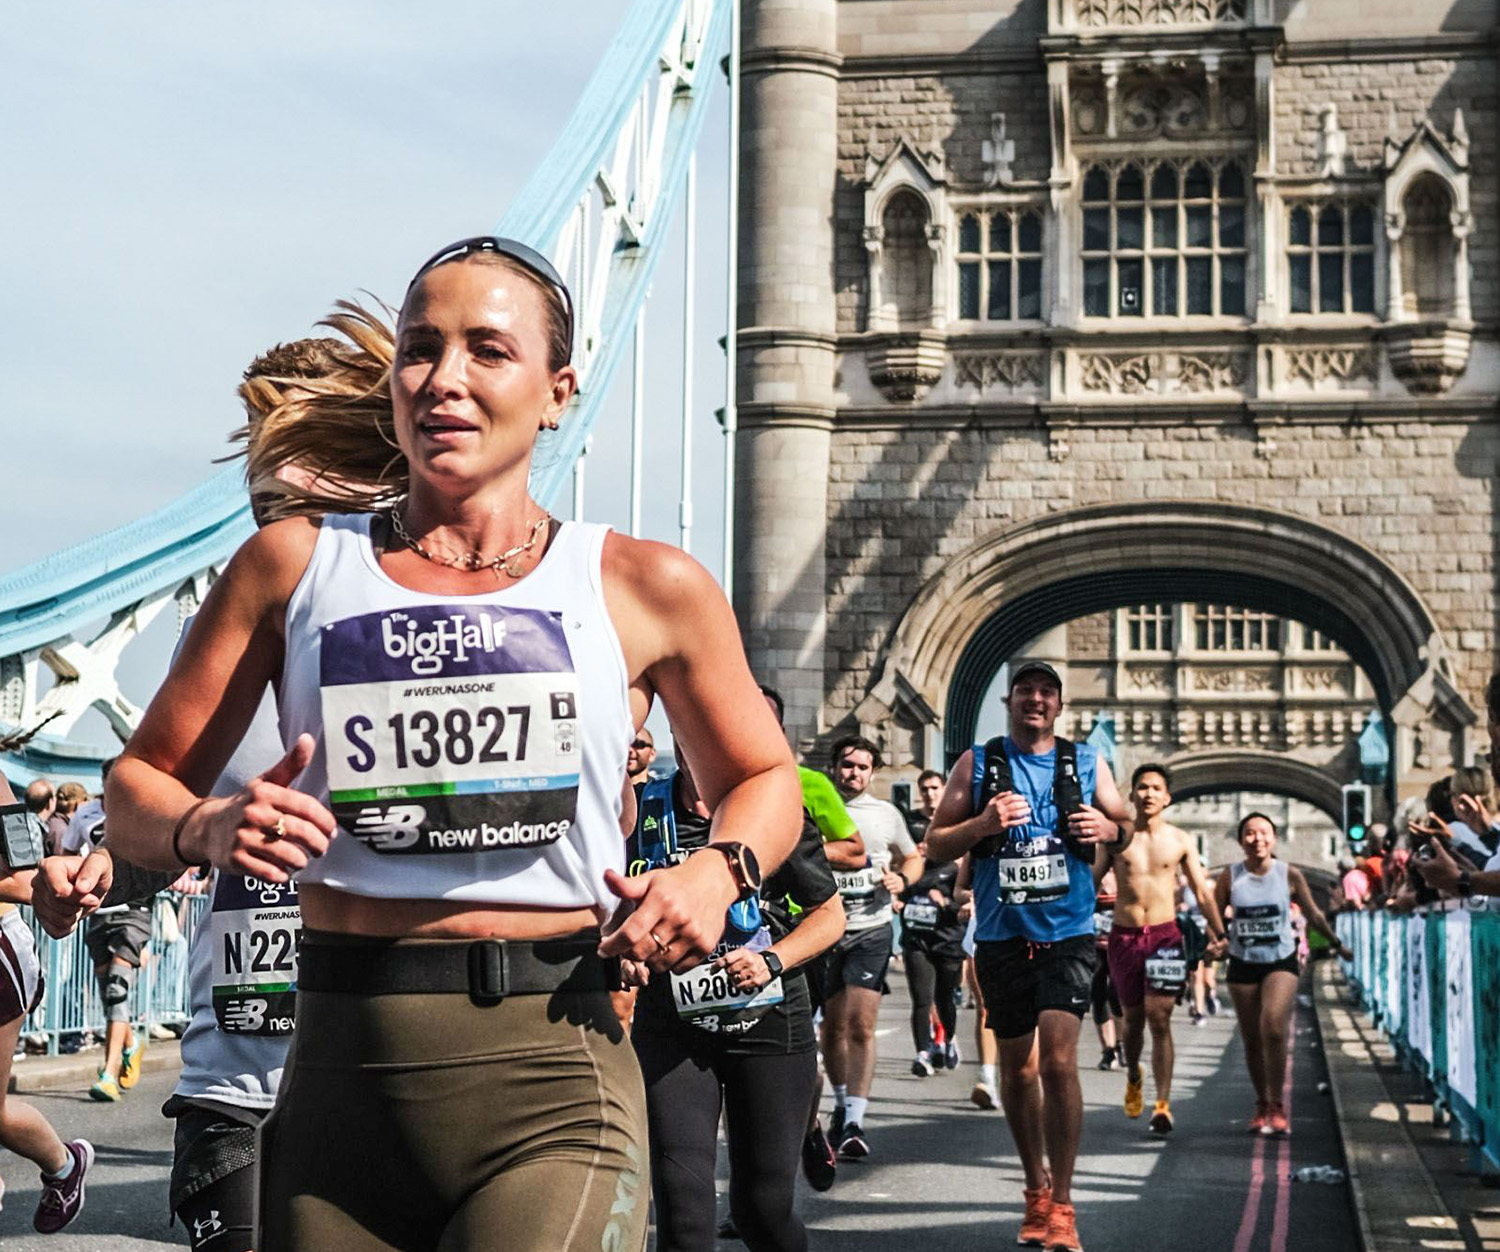
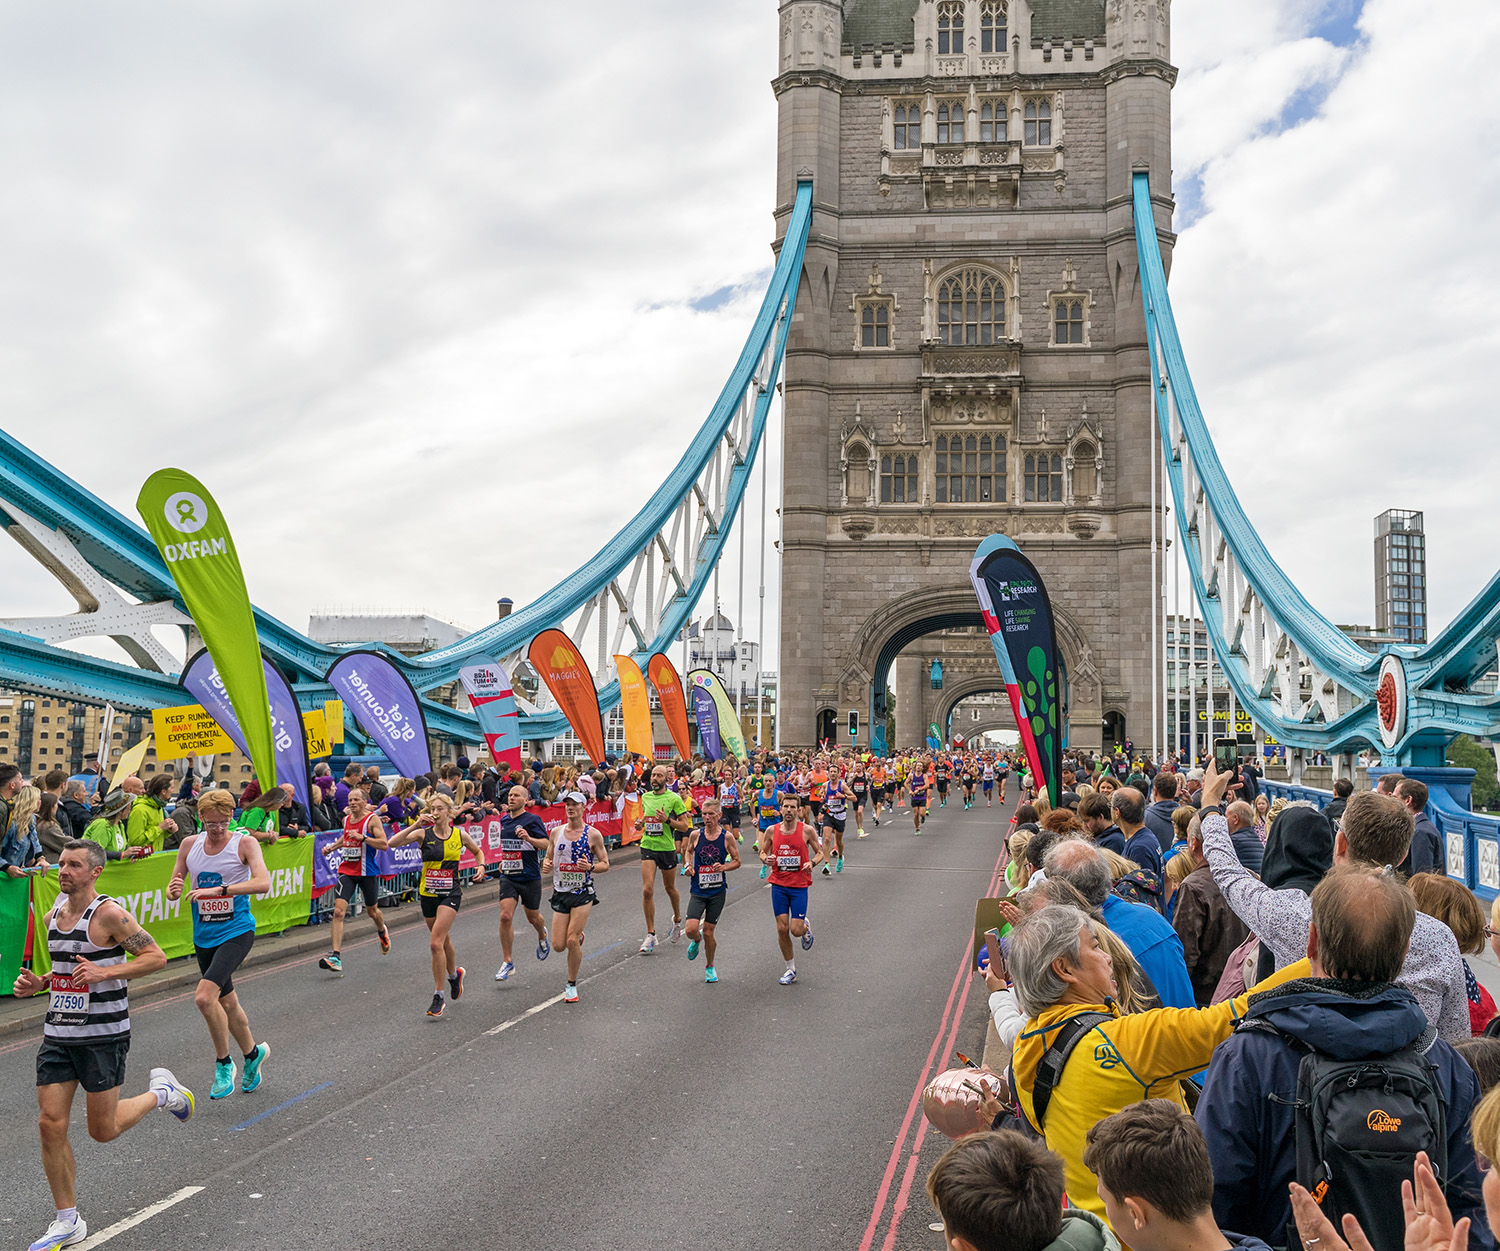
Runners to Follow at London Marathon 2024
One of the great marathon events of the year, the London Marathon attracts more than 54,000 runners from around the world. But who should you follow?
Multi-Sport
How To Maintain Your Training Consistency When Life 'Gets In The Way'
Whatever our exercise intentions, life can often ‘get in the way’ of them. However, there are some simple things you can do to help manage your mind - and your body - to stay motivated and consistent in your training.
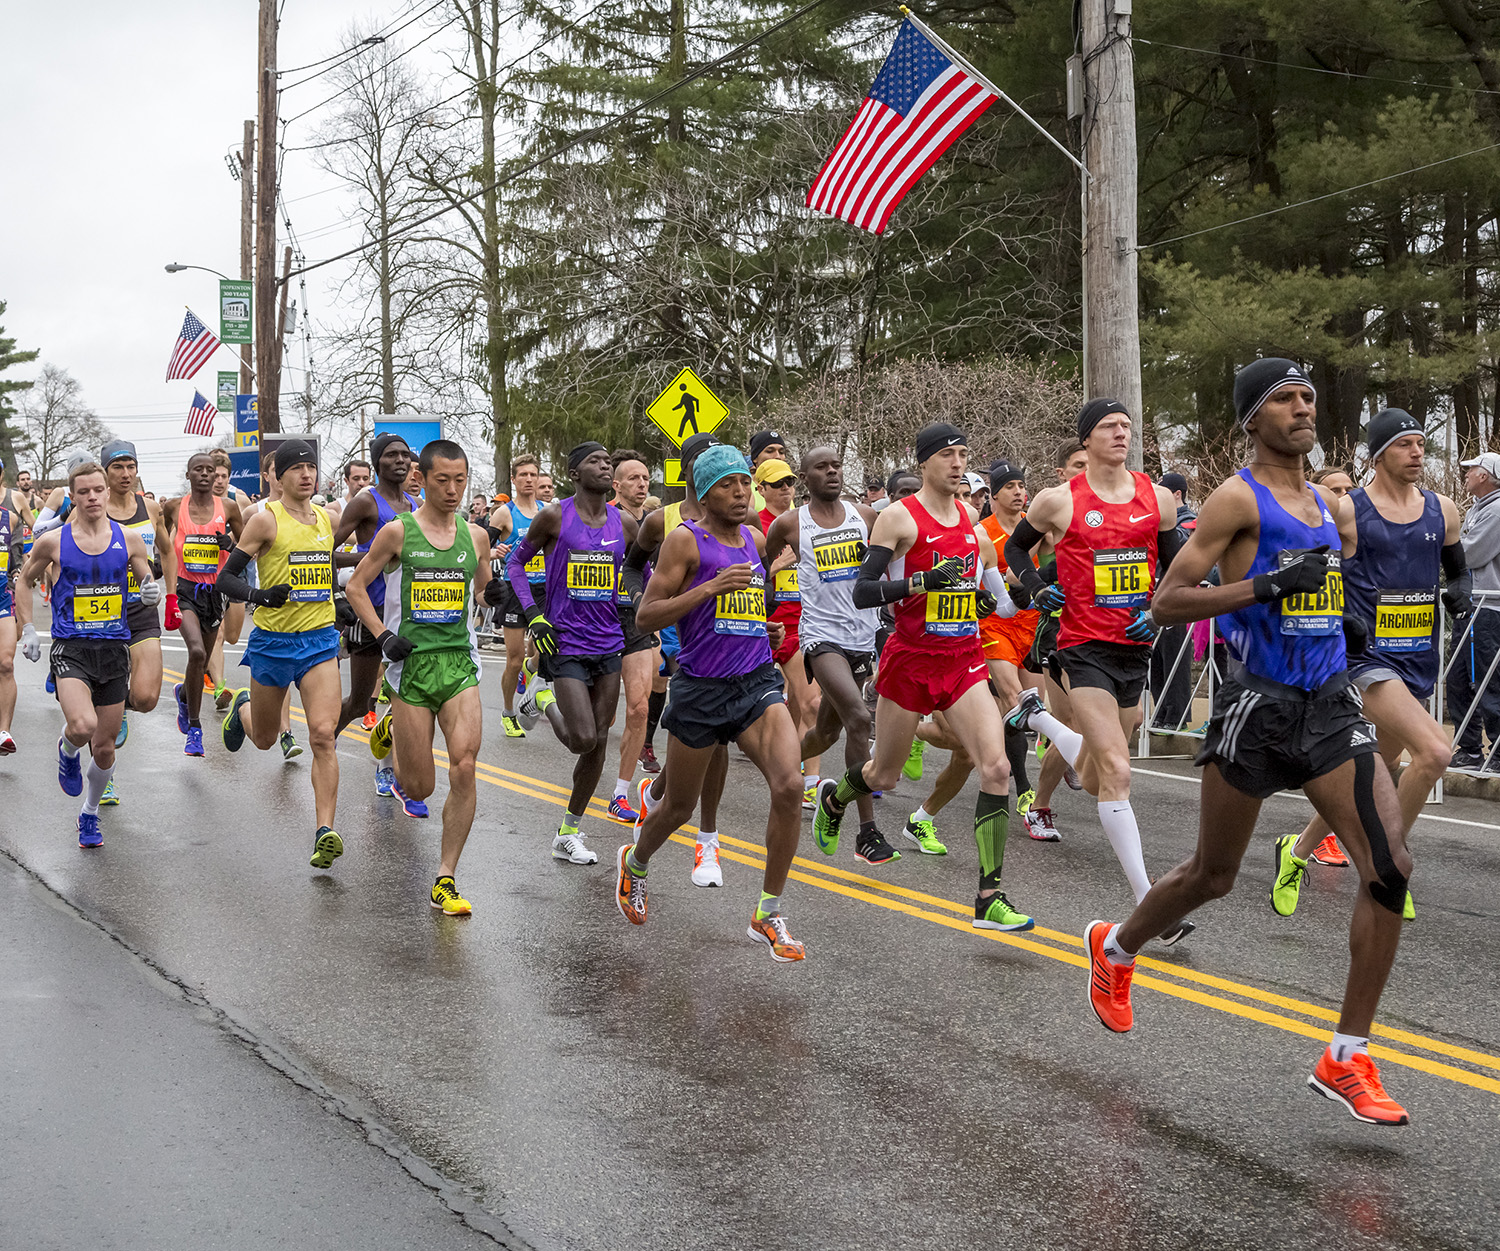

Run
Runners to Follow at Boston Marathon 2024
One of the most revered events on the running calendar, but who to follow at the 2024 Boston Marathon. This is our list of Strava Athletes you will want to be sharing the kudos with.

Strava Updates
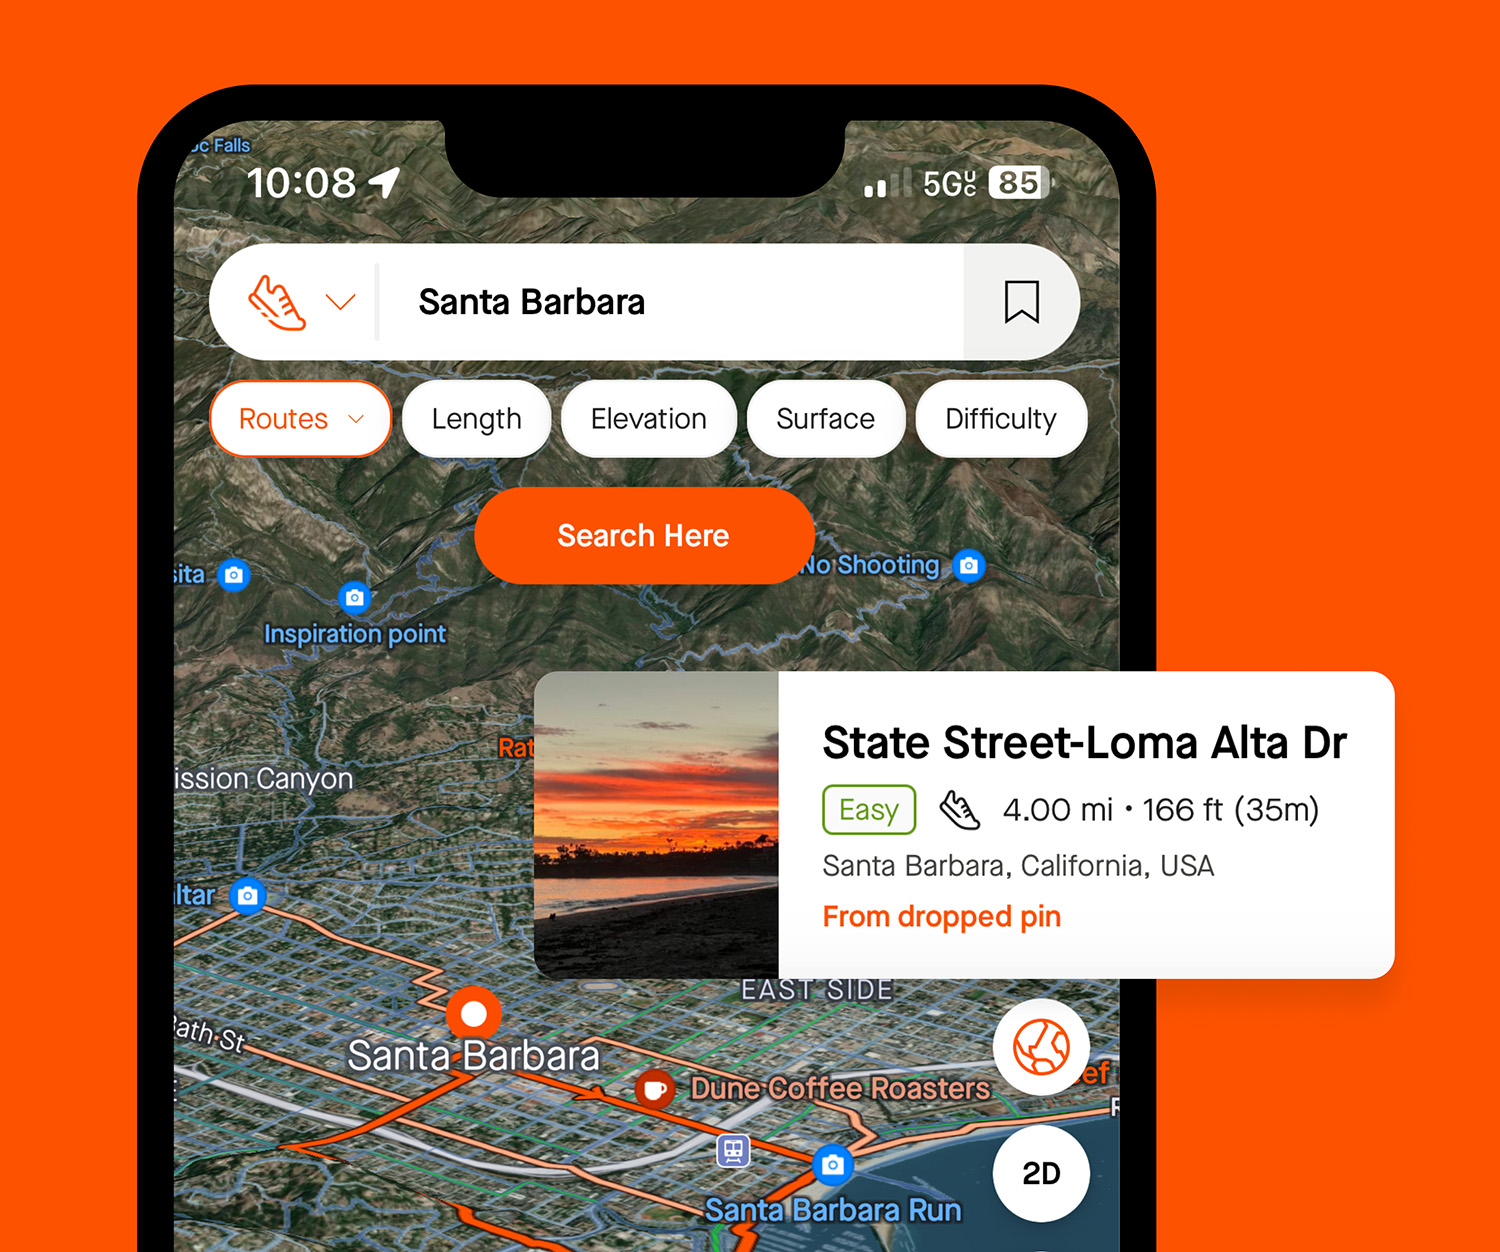
It Just Got Easier To Plan A Route With Strava Maps
With the new-look Strava maps, it’s a lot – and we mean a lot – easier for subscribers to get and use a new route custom-built for you.
Ride
Roadie, MTB… Both?! Don’t Let a Tribal Mindset Limit Your Cycling
Cycling can often be a tribal activity. But if cyclists like roadies and MTBers can put their differences aside, moving between disciplines can have real benefits for everyone who enjoys being on two wheels.

Multi-Sport
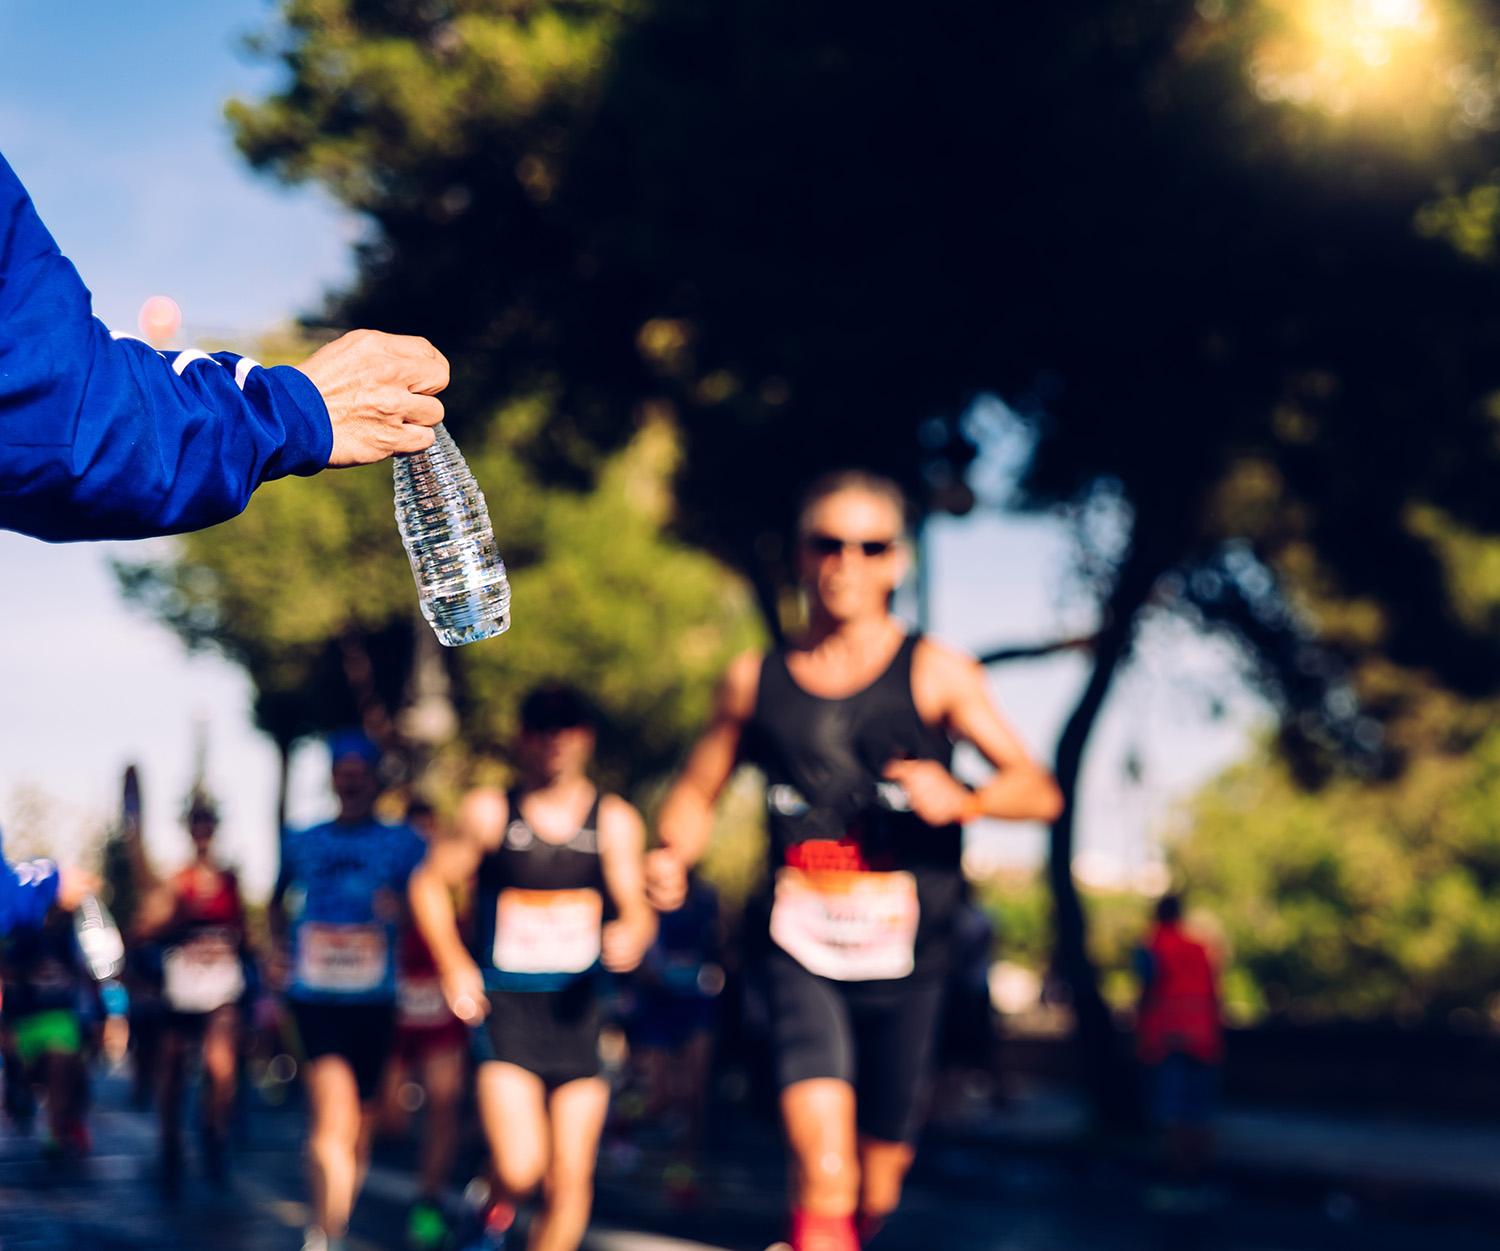
Nutrition Strategies: Making or Breaking Your Race
Nutrition can make or break a race, especially in endurance events. But while most athletes see nutrition through the lens of fuel or recovery, it is also an integral part of optimizing your performance.

Multi-Sport
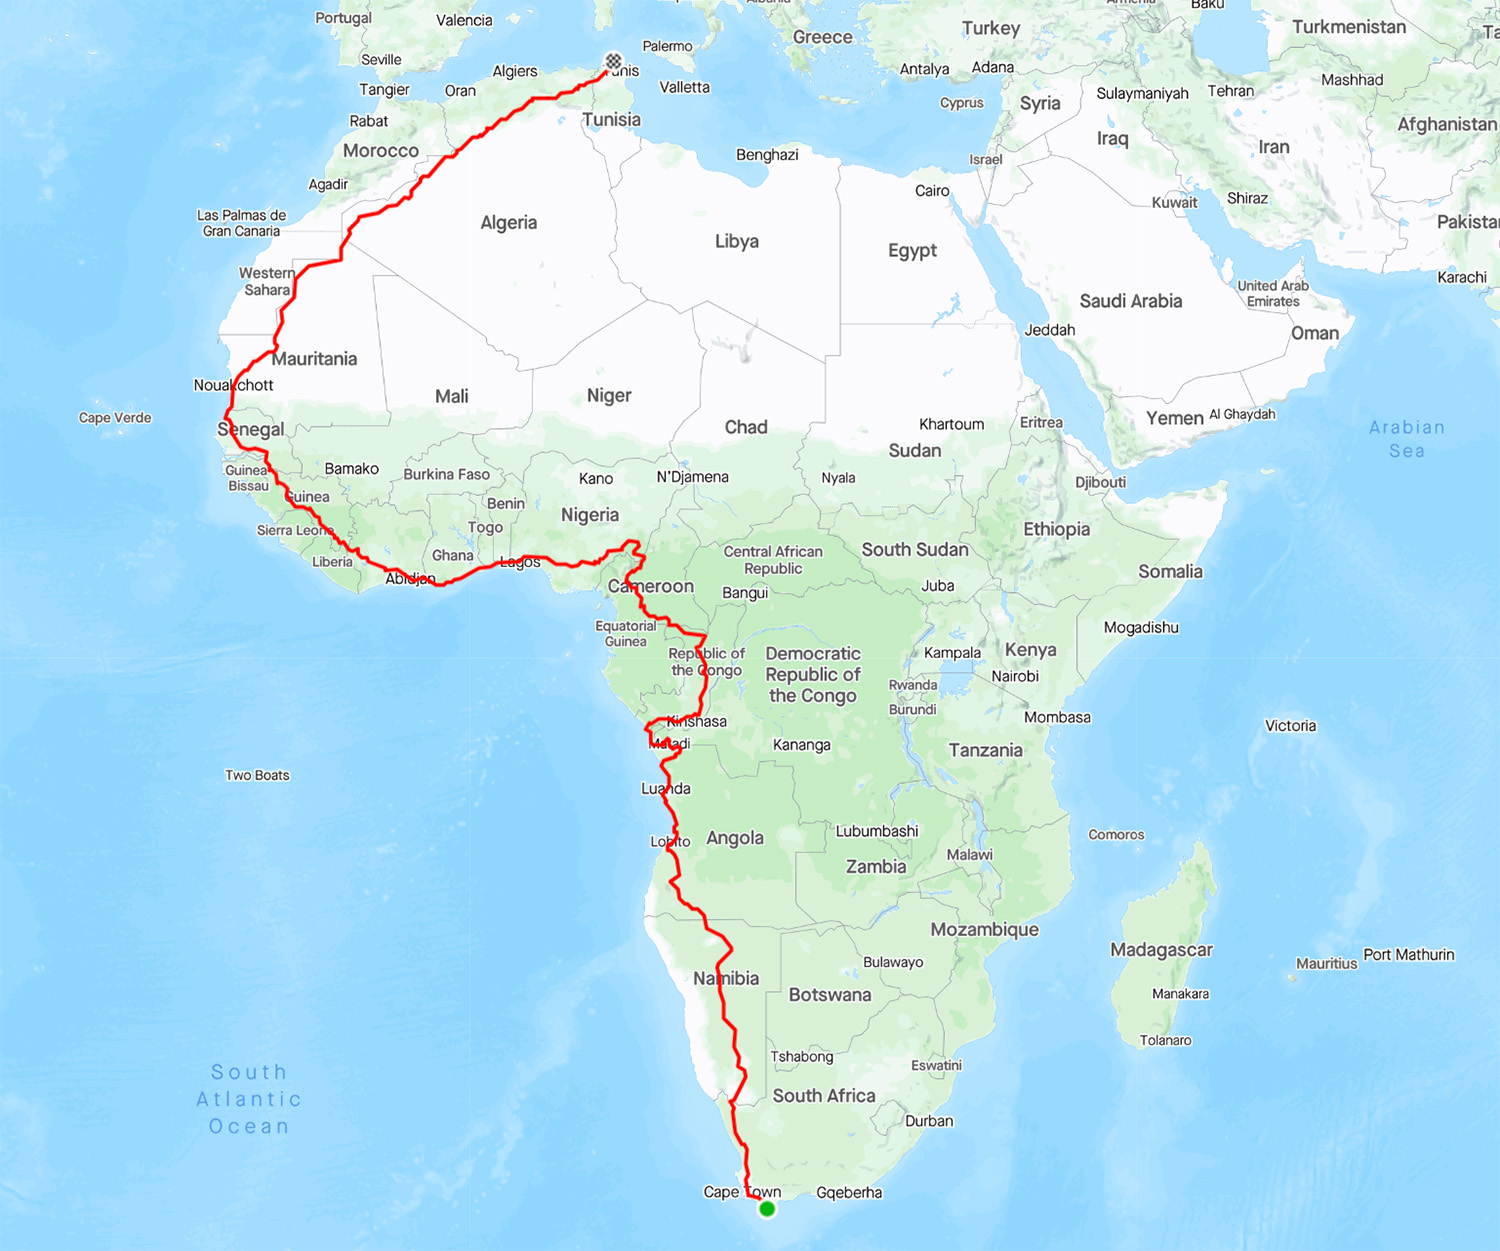
Spotted on Strava: Running Africa, Paris Marathon and Wout's Walk
From the shores of Tunisia (by way of an epic run) to the boulevards of Paris and the frozen seas off Finland, there's been plenty to look out for on Strava this week.
Run
How to Increase Your VO2 Max
VO2 max used to be a niche subject amongst core endurance athletes. However, given its relationship to performance, more and more athletes are looking learning about the subject.

Hiking
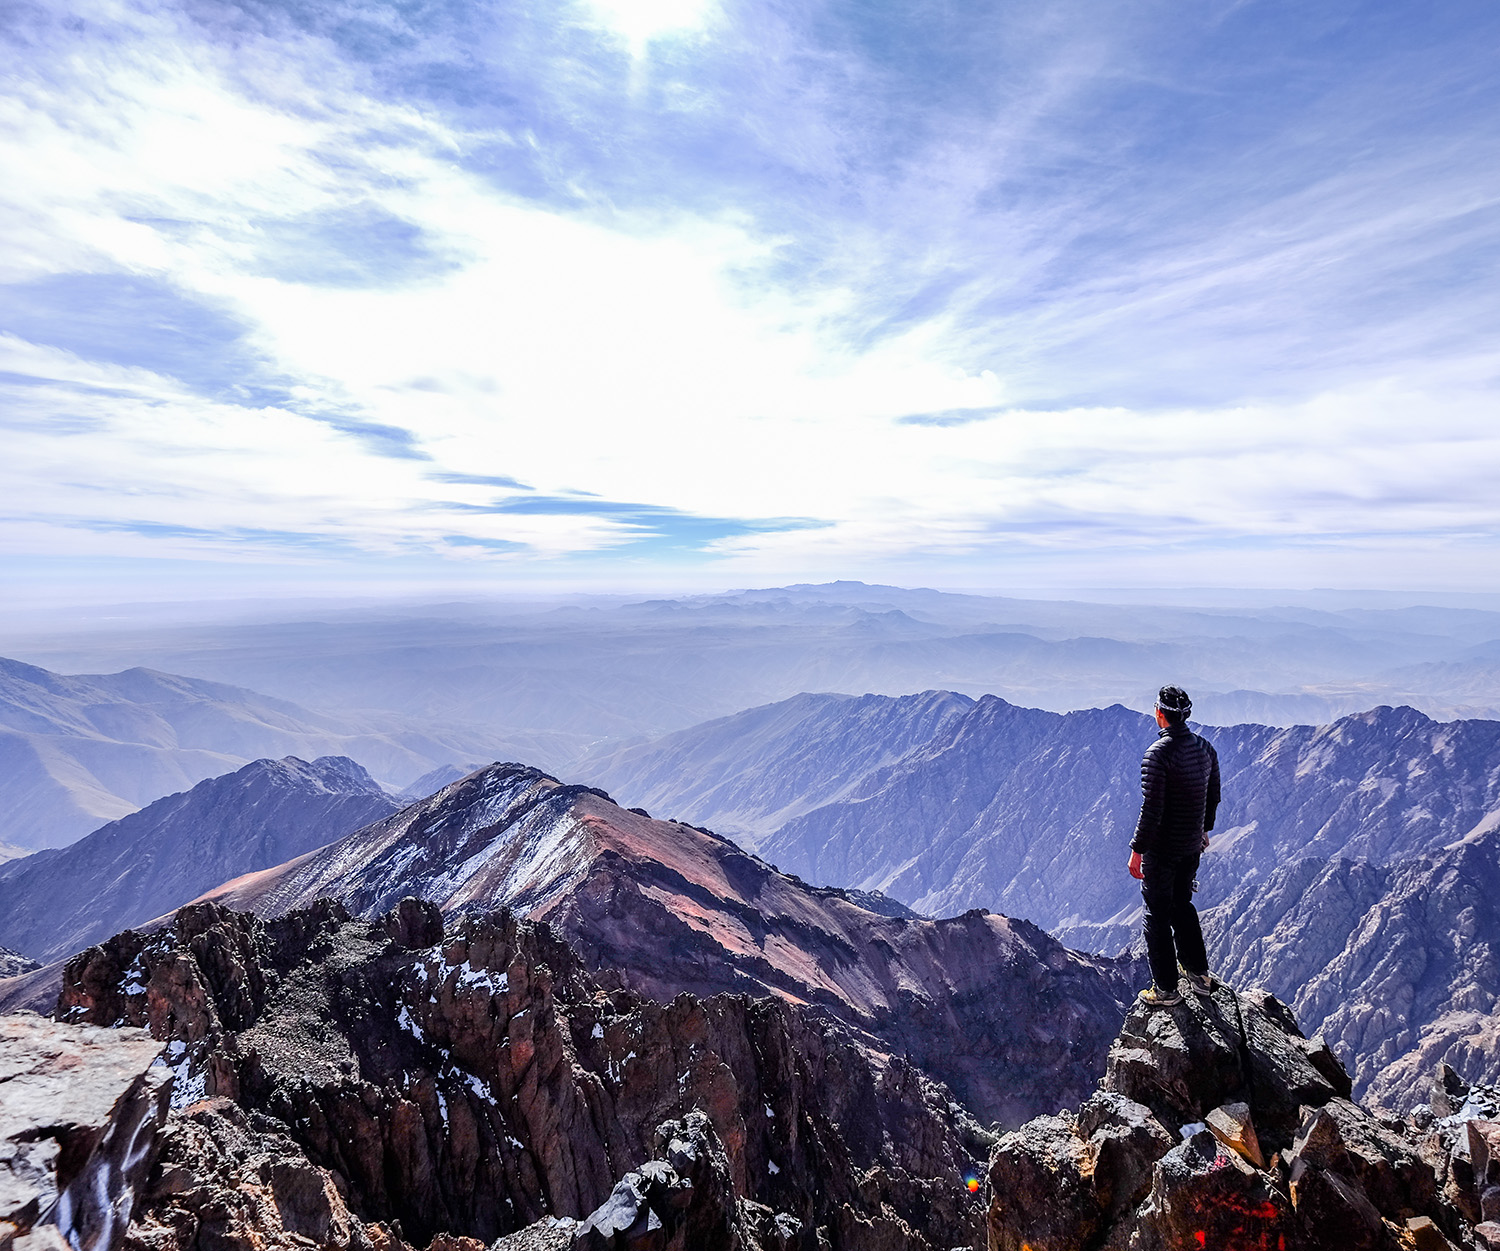
From Marrakech to the Mountains: Trekking Adventures in Morocco's Backcountry
Embark on a journey of discovery through the breathtaking landscapes and rich cultural tapestry of Morocco's mountains.