Strava Stories


Run
All Stories

Multi-Sport
Strava Segments With The Most Efforts: How Many Have You Completed?
Which are the most popular Strava segments in the world? Our experts have analyzed the stats, crunched the numbers, and come up with a list of some of the segments most completed by athletes in different distance categories.

Run
‘Running Saved my Life’: Sophie Grace Holmes on Living with Cystic Fibrosis
Sophie Grace Holmes defies Cystic Fibrosis as an ultra-endurance athlete. Here, she shares how living each day to the fullest fuels both her sporting success and her passion for life.

Run
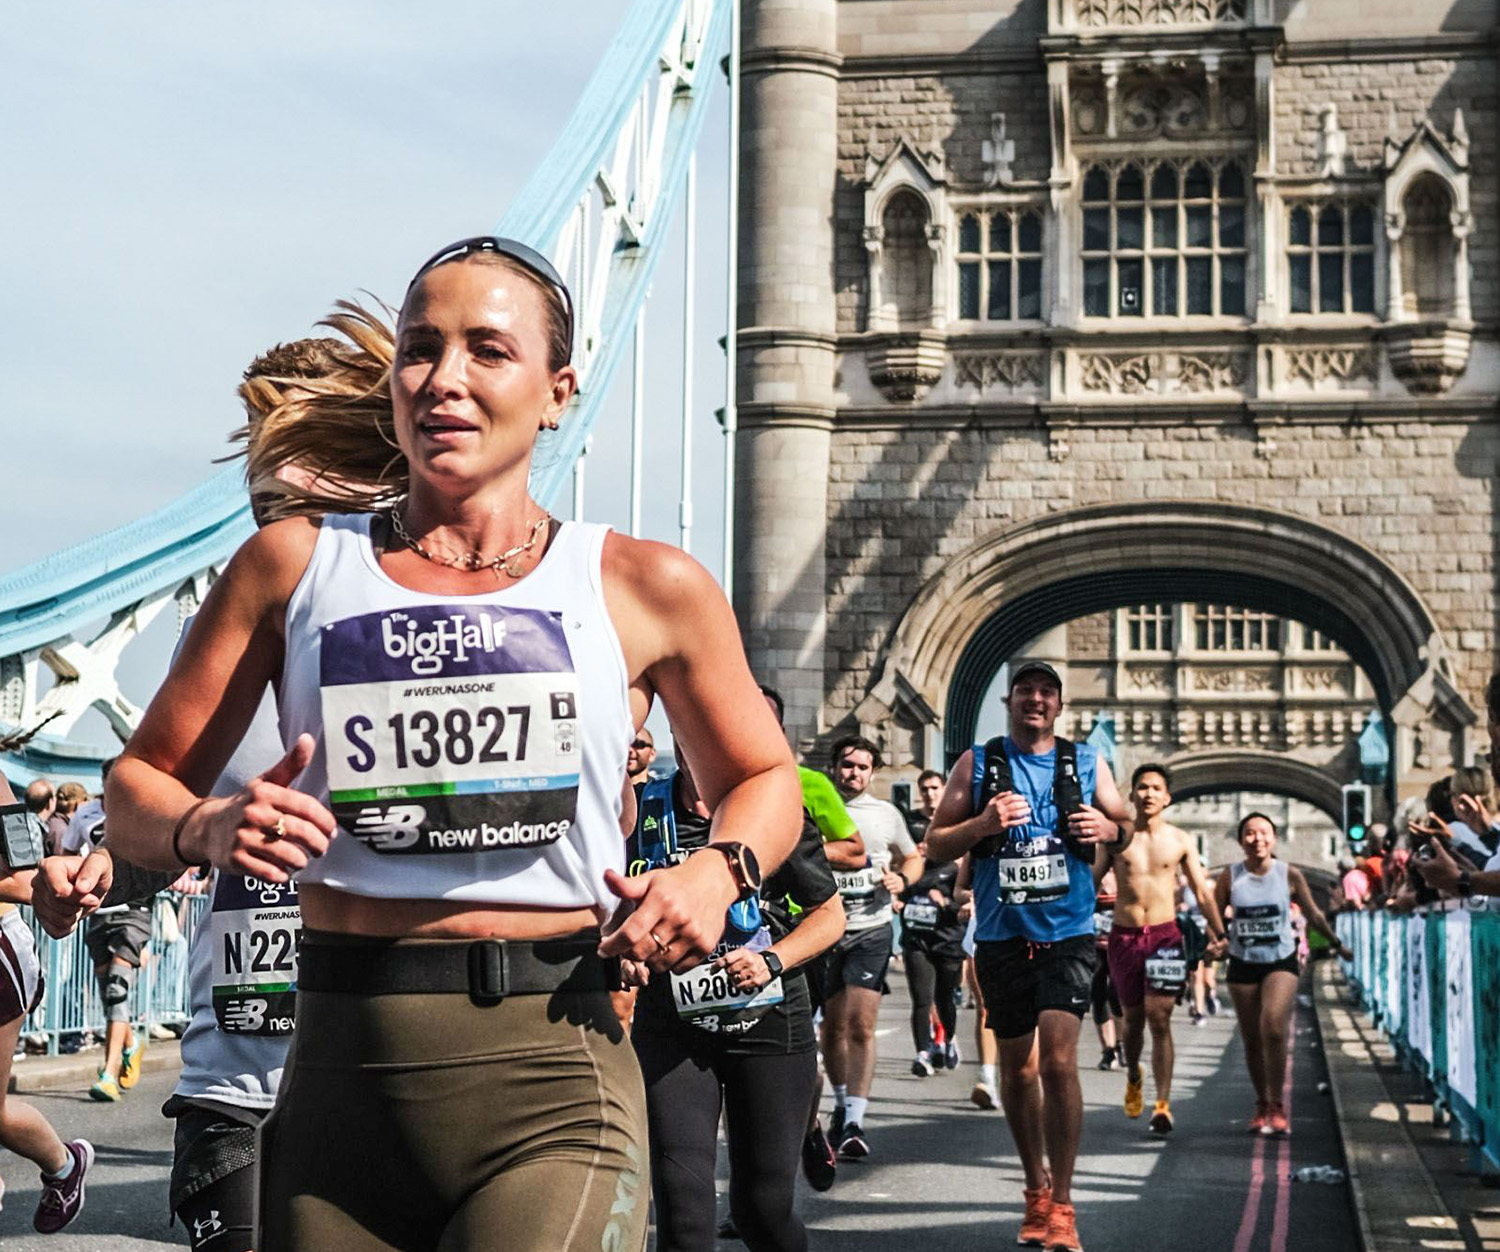
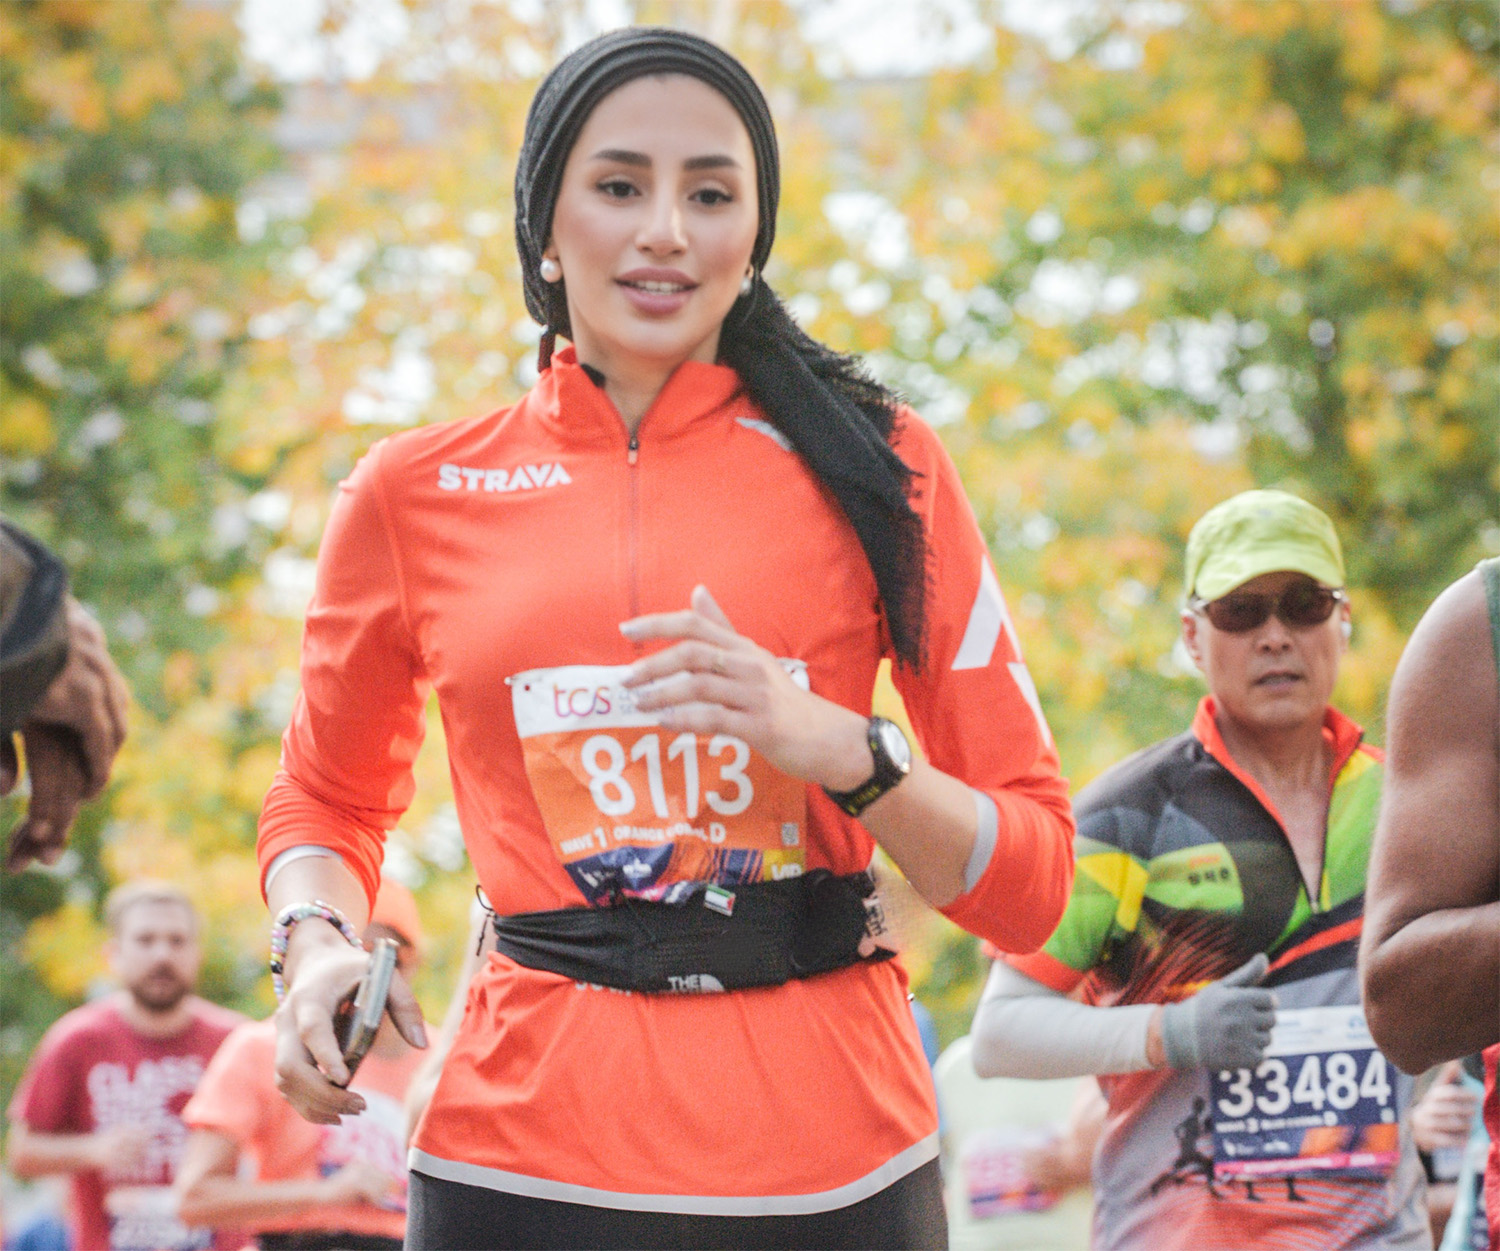
Zahra Rose: Inspiring the Next Generation of Muslim Runners
Join Zahra Rose Alazaibi's inspiring journey as she breaks barriers, fosters Muslim representation, and empowers the next generation in the UK's running scene.
Ride
All Stories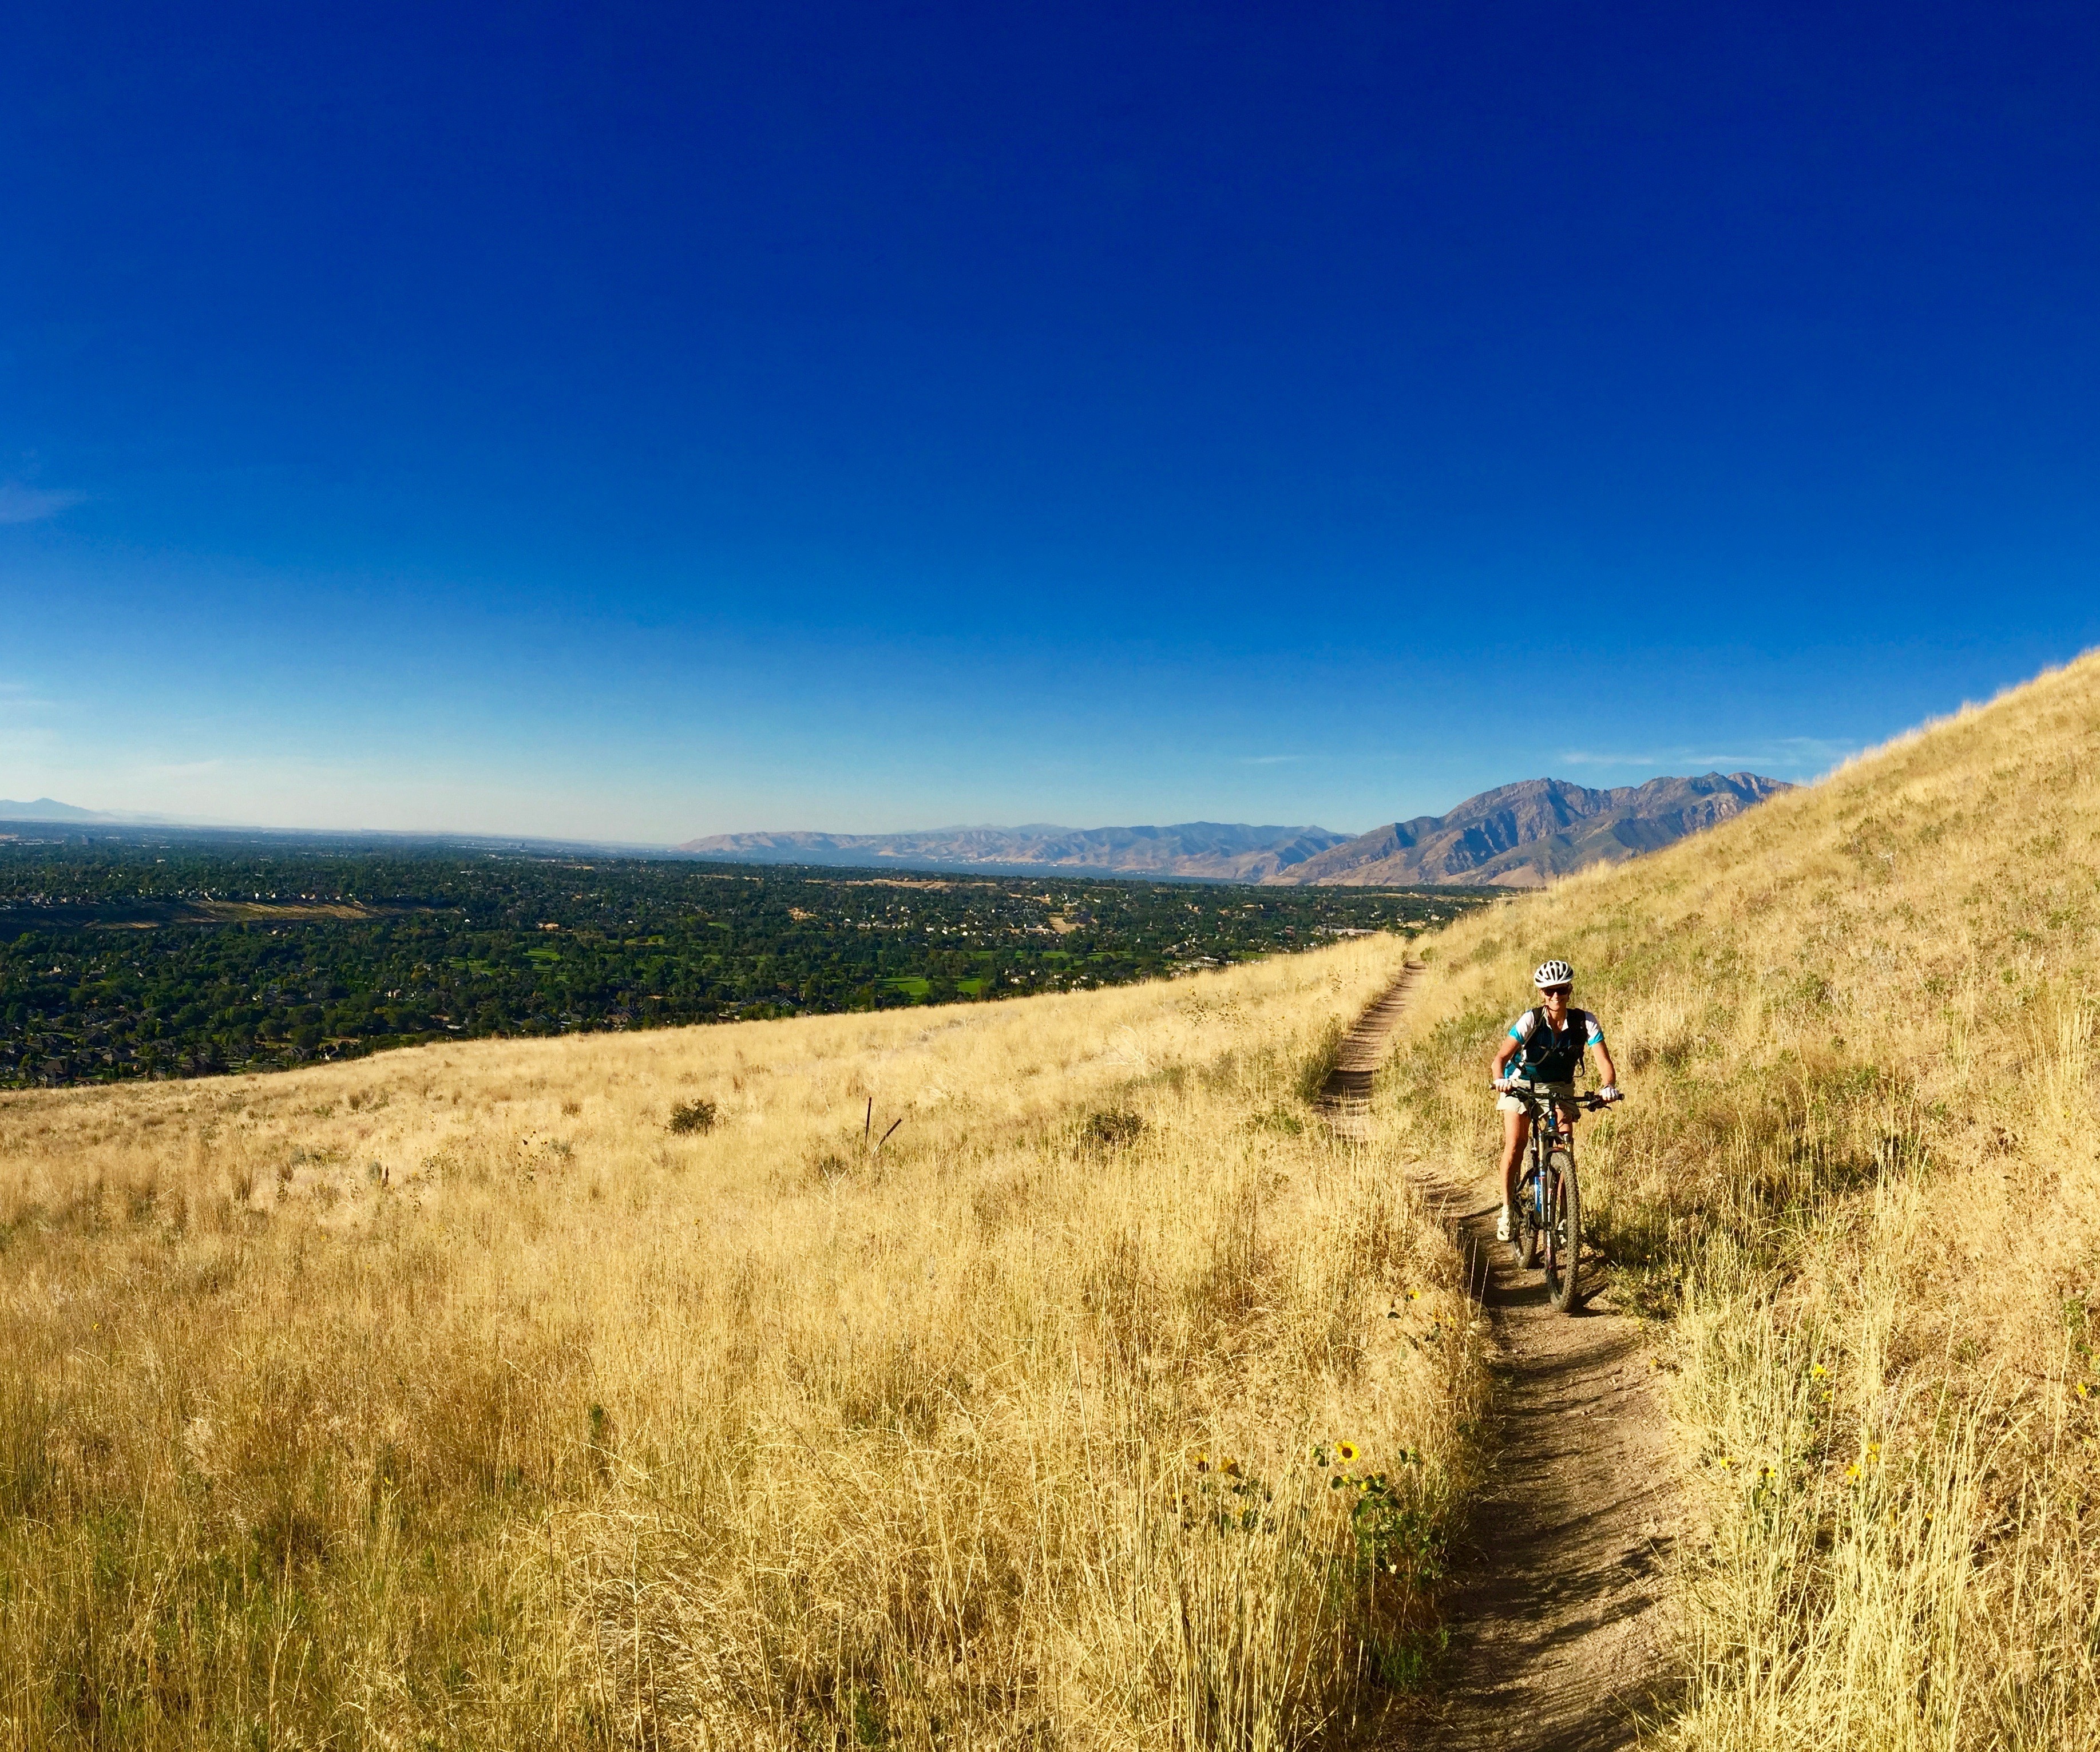

Mountain Biking
Passage of a Historic Congressional Bill Unblocks Completion of Utah's Bonneville Shoreline Trail
The visionary 280-mile point-to-point Bonneville Shoreline Trail takes a massive step closer to completion thanks to a historic Wilderness area land swap bill that unanimously passed in Congress.

Ride
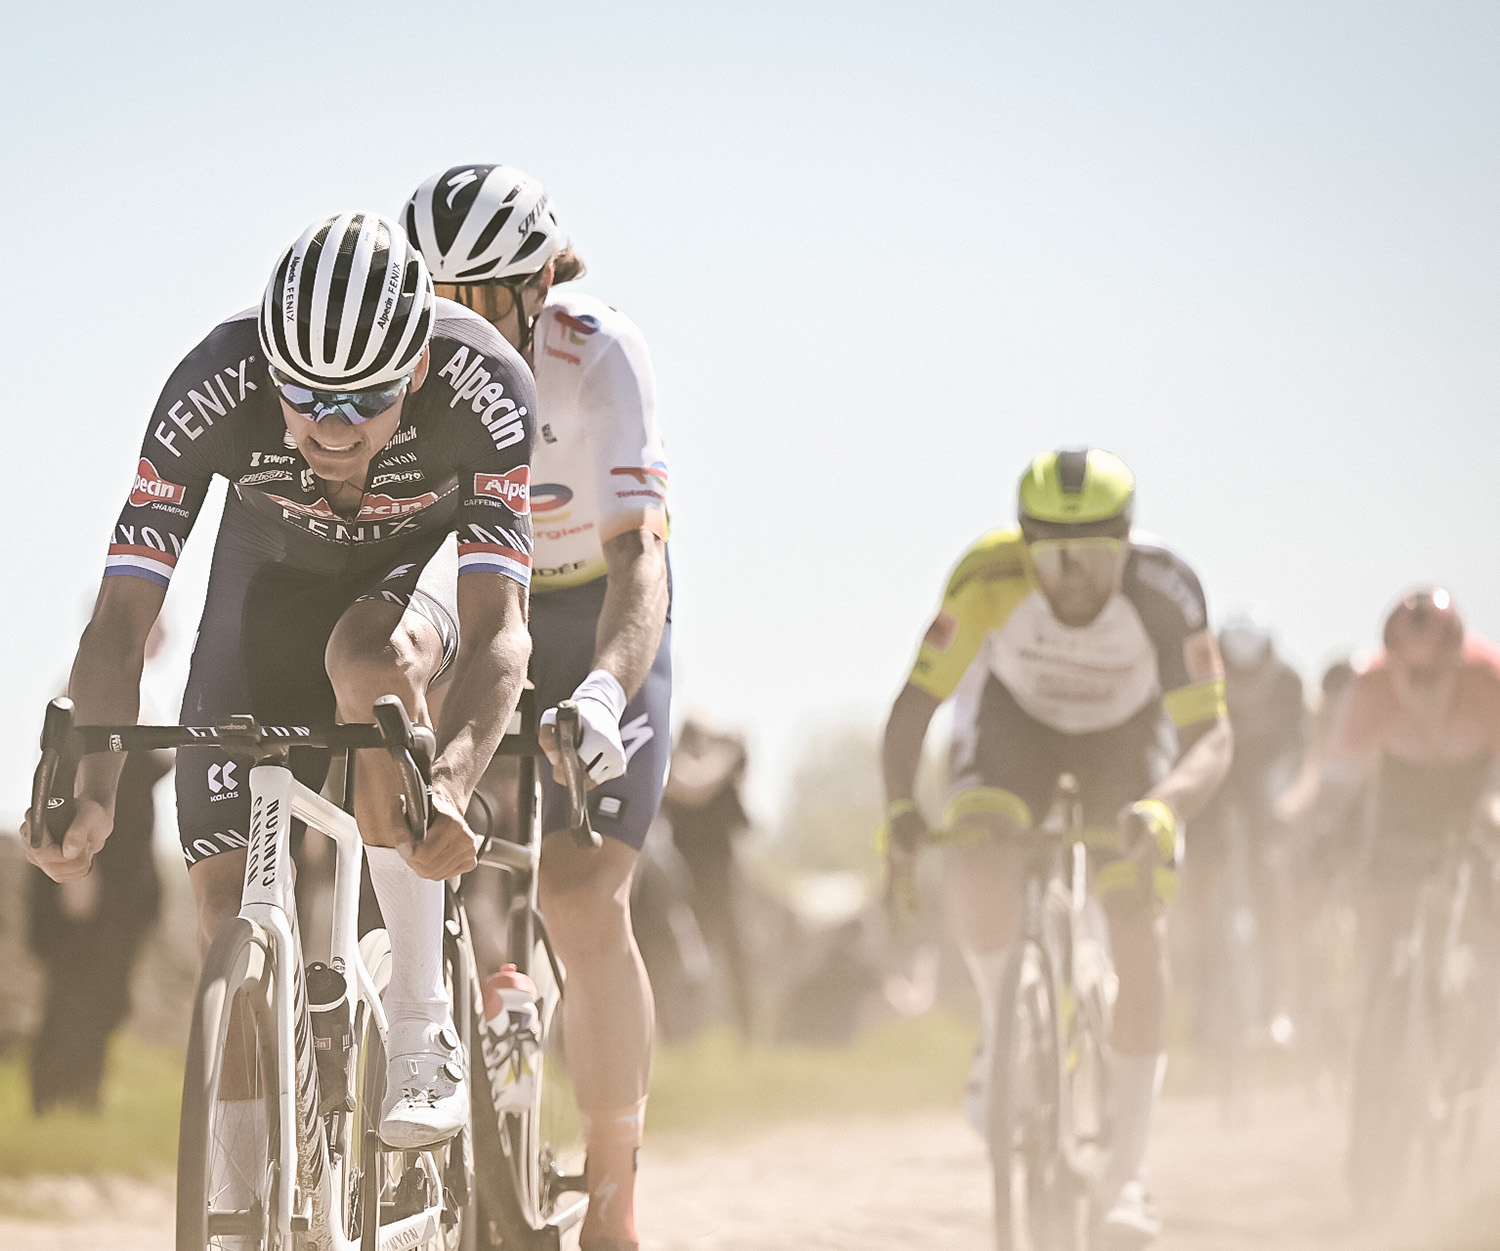
Paris-Roubaix: The Key Strava Segments
The 2024 Paris-Roubaix and Paris-Roubaix Femmes promises to deliver one of the most anticipated races of the Spring. Max Leonard previews the course and the segments that can make or break the riders.


Ride
Roadie, MTB… Both?! Don’t Let a Tribal Mindset Limit Your Cycling
Cycling can often be a tribal activity. But if cyclists like roadies and MTBers can put their differences aside, moving between disciplines can have real benefits for everyone who enjoys being on two wheels.
From Our Partners
All StoriesSTRAVA | Brooks


Run
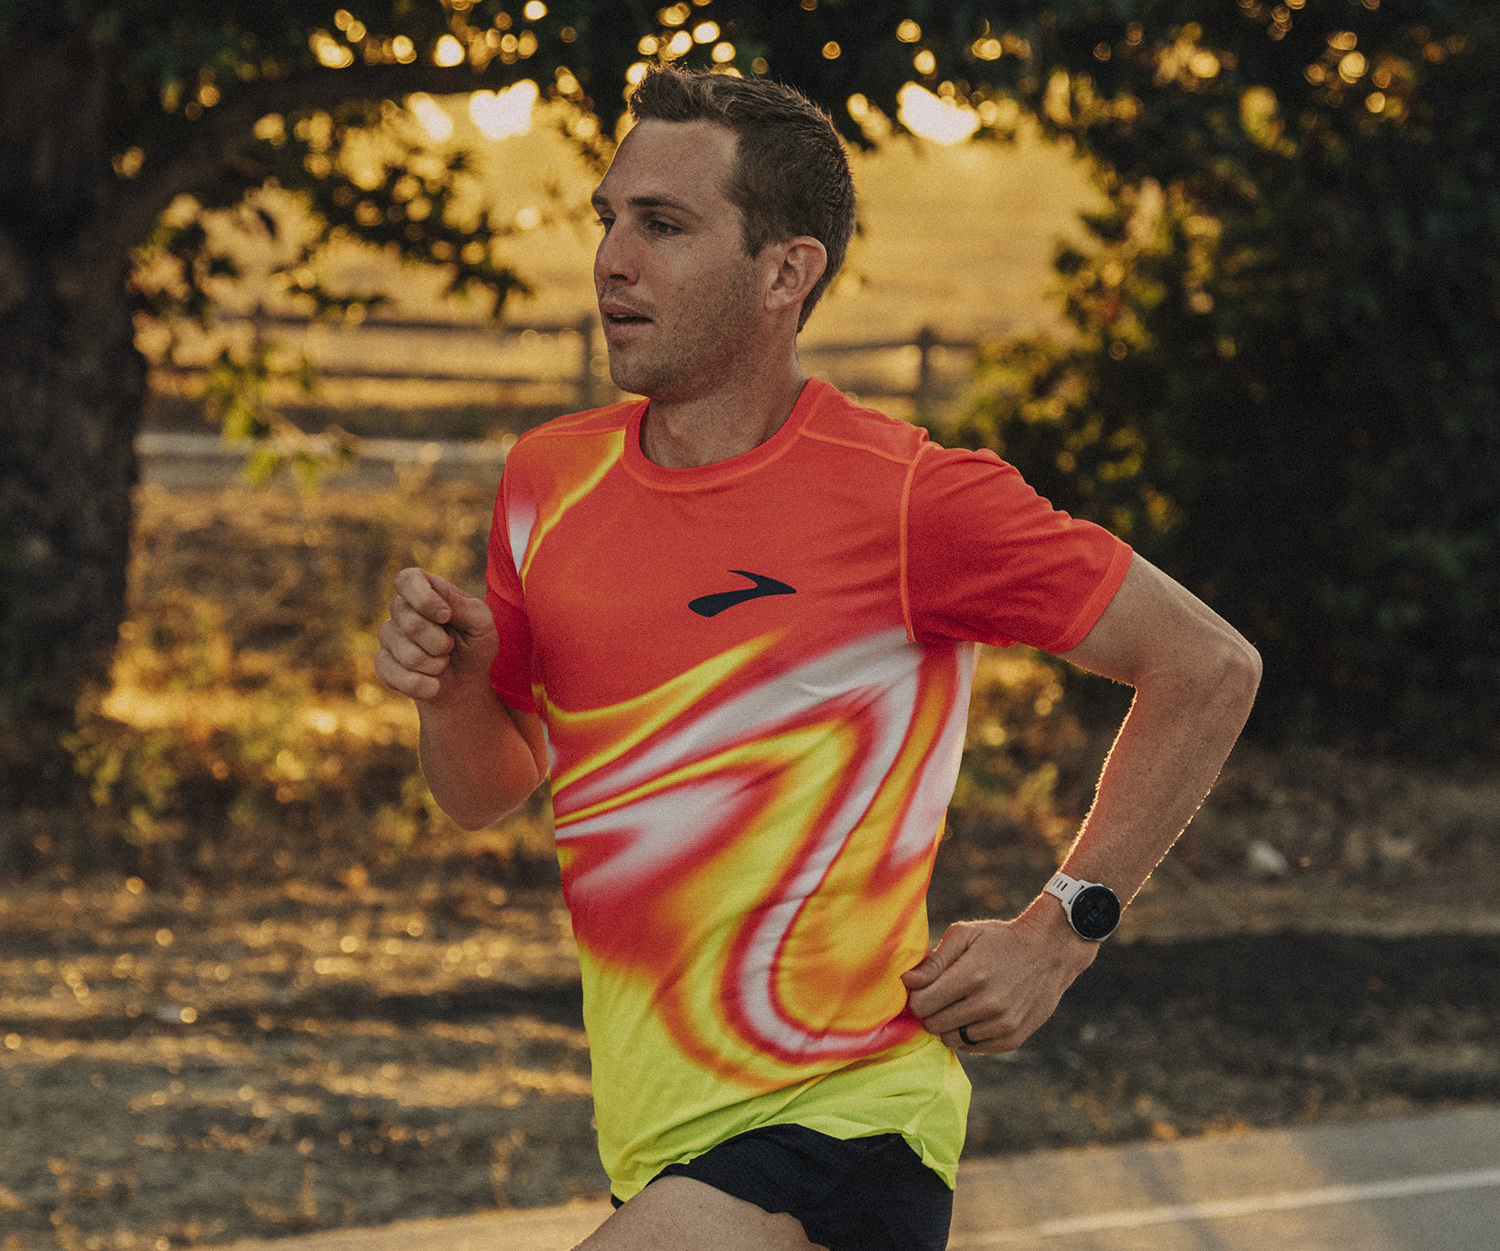
Run into Spring: Essential Gear for Racing Season
As days get longer and temperatures get warmer spring racing season is right around the corner and we’re outlining the gear you need, whether you’re training for your first 5K or your marathon PR.
Paid Partnership
STRAVA | Brooks

Run
CJ Albertson: A 2:10 Pro Marathoner’s Unique Coaching Tips
Meet CJ Albertson – 2:10:07 pro marathoner for Brooks Running, dad of two, running coach extraordinaire, and master of the quirkiest marathon training methods.
Paid Partnership
STRAVA | JOIN Cycling

Ride
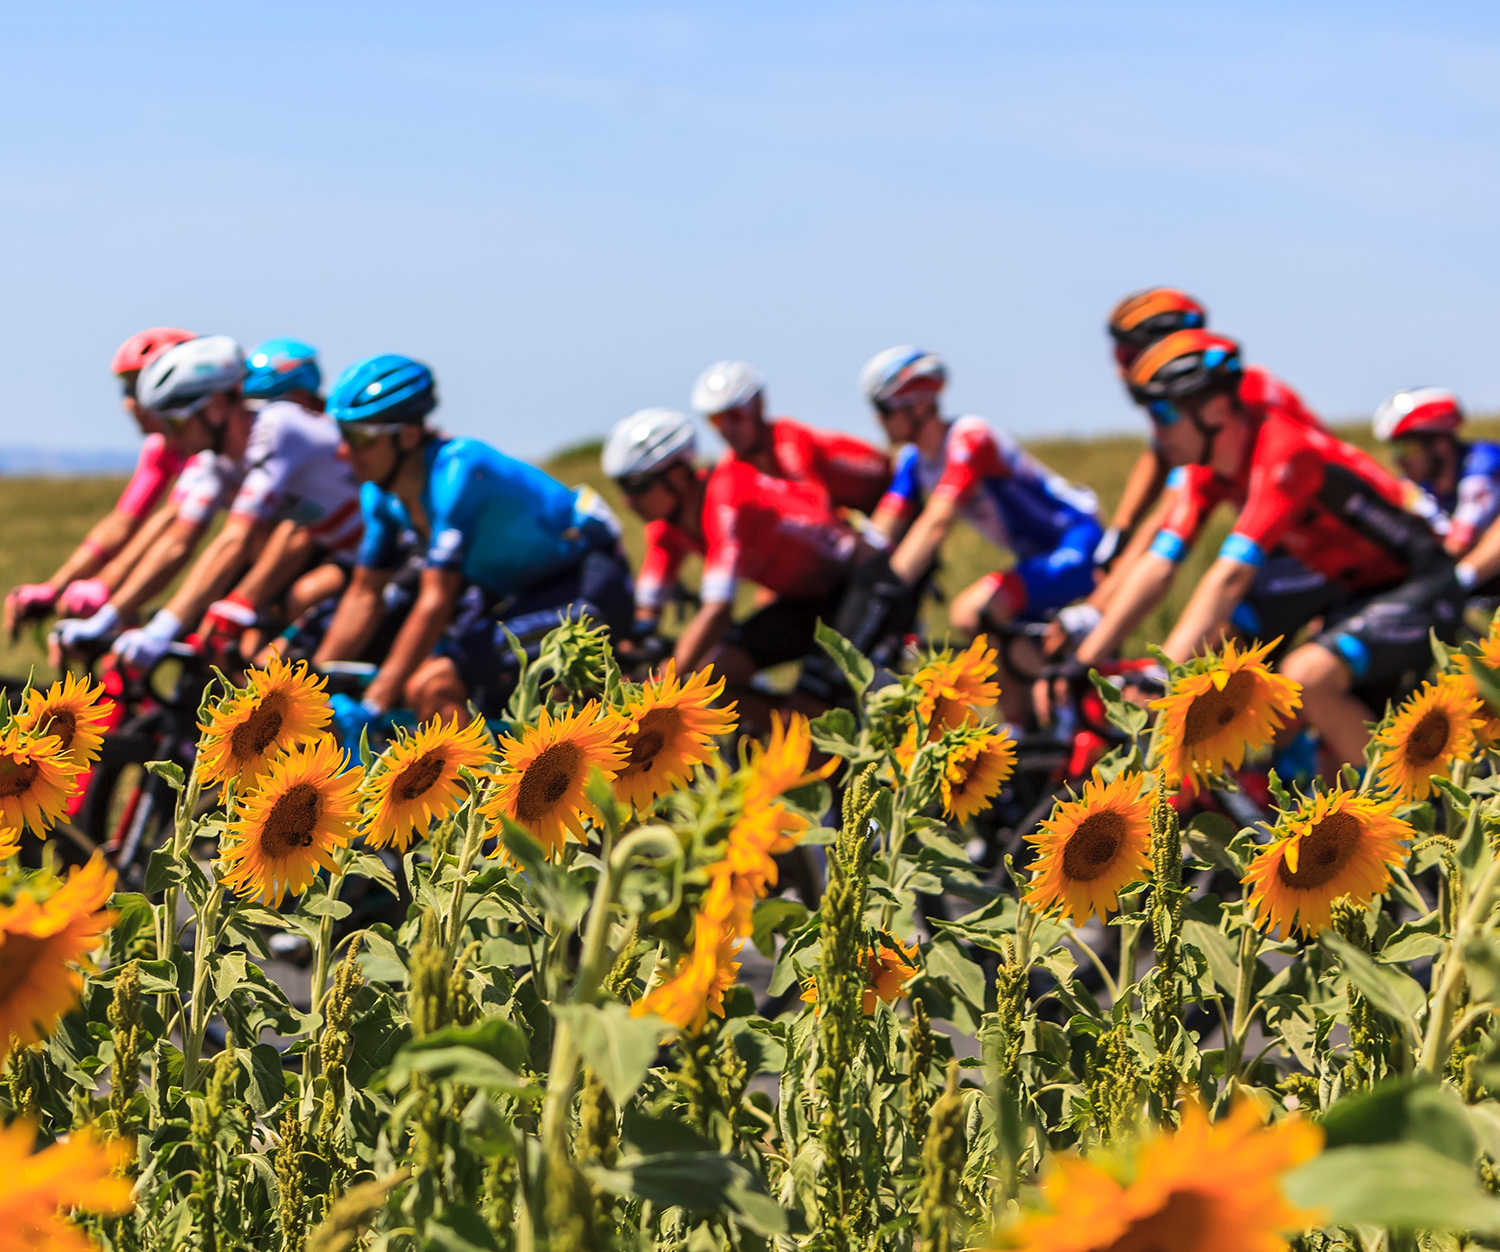
How Pro Cyclists' Lives Have Gotten More Complex in the Last 10 Years
Over the past 10 years, the lives of professional cyclists have gotten dramatically more complex... and that's not always a bad thing, argues Jim van den Berg.
Paid Partnership
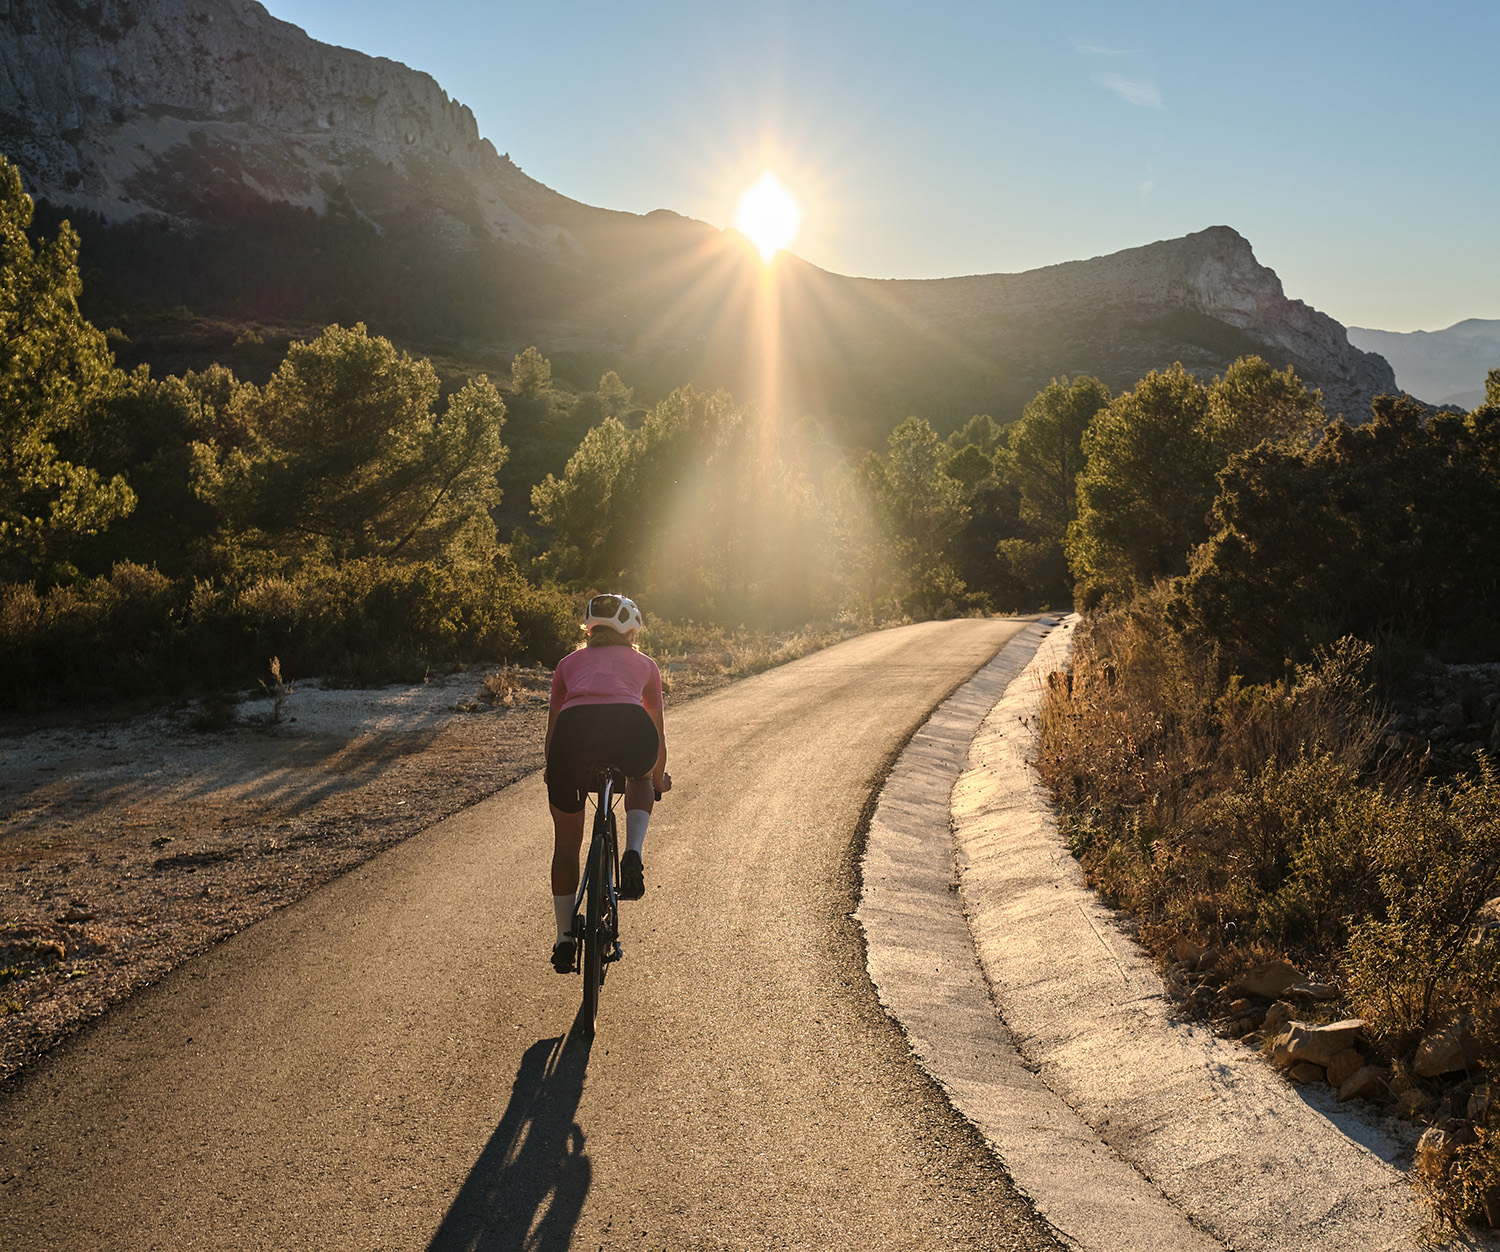
Training
All Stories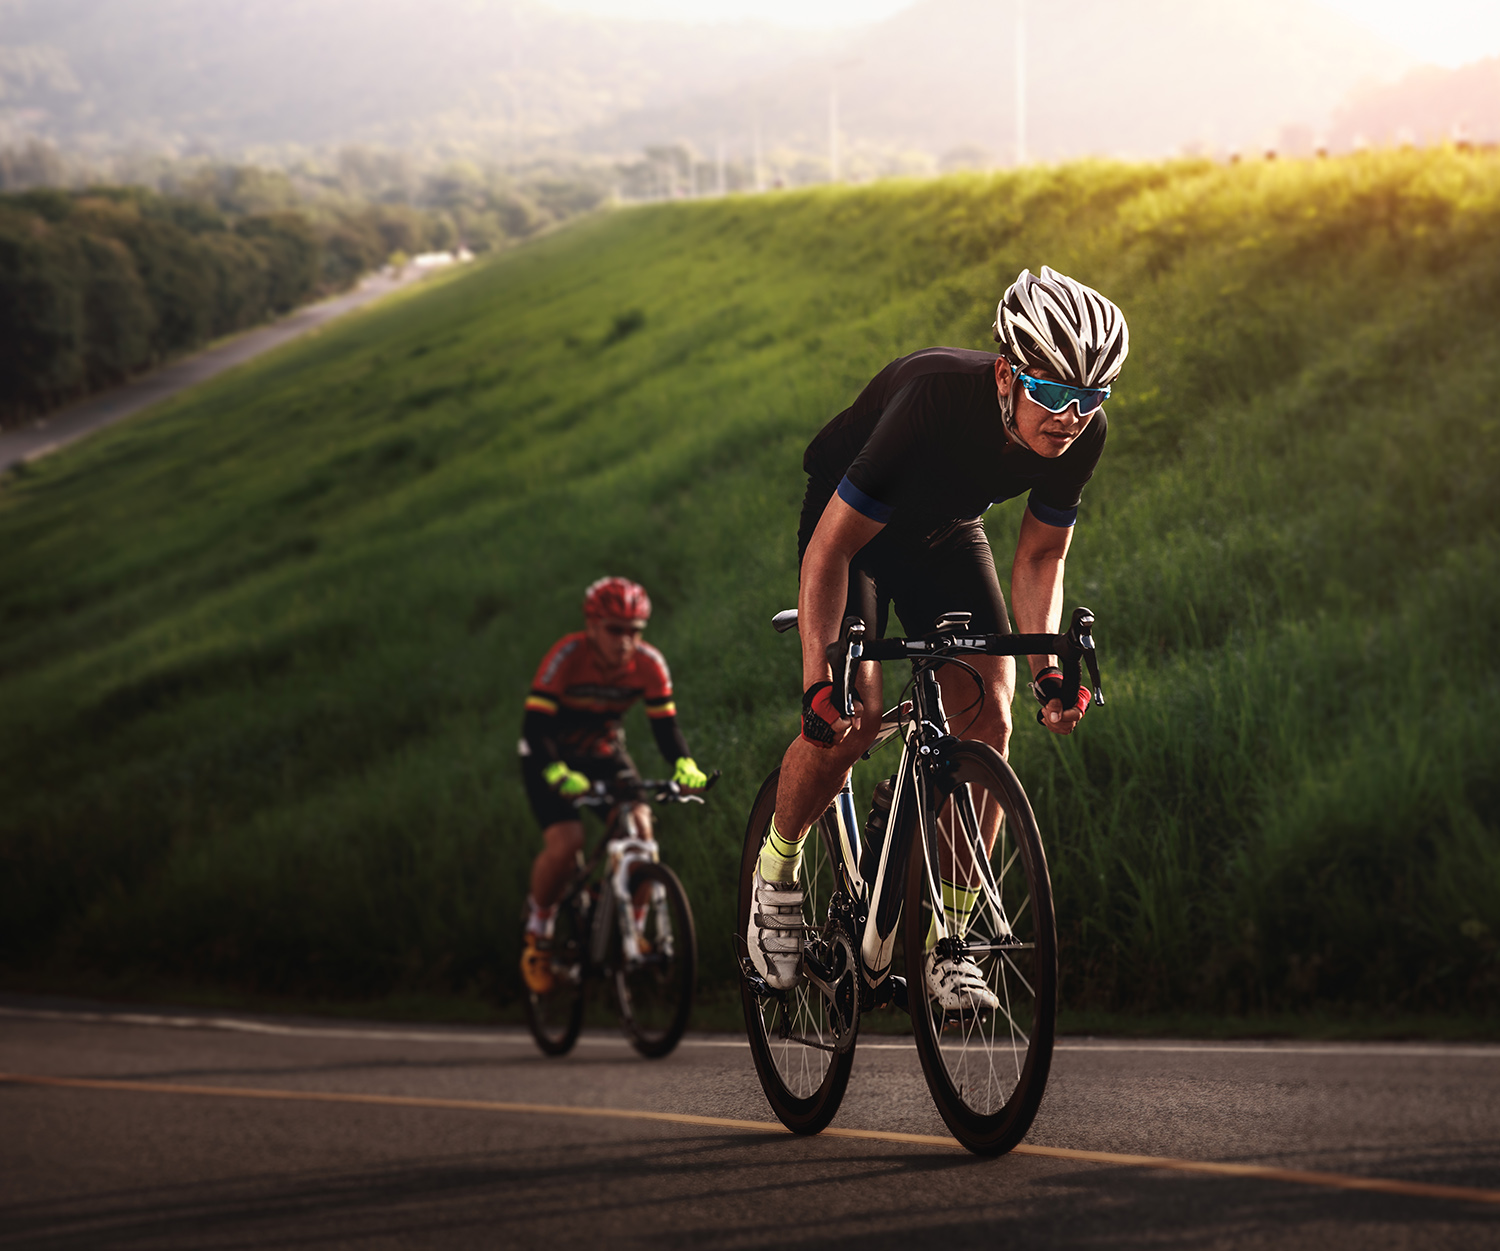

Ride
Low Risk, High Reward: The Polarized Training Method for Cyclists
Can you make significant performance and fitness gains with just three types of rides? The science says yes.


Multi-Sport
How To Stay Fit While Traveling
Charlie shares a host of useful tools and tactics that you can use to stay in shape while traveling.


Run
How To Train for a 10K
Training for a 10k takes several weeks and many types of workouts, but running a fast 10k makes the effort worthwhile.
What's New
All Stories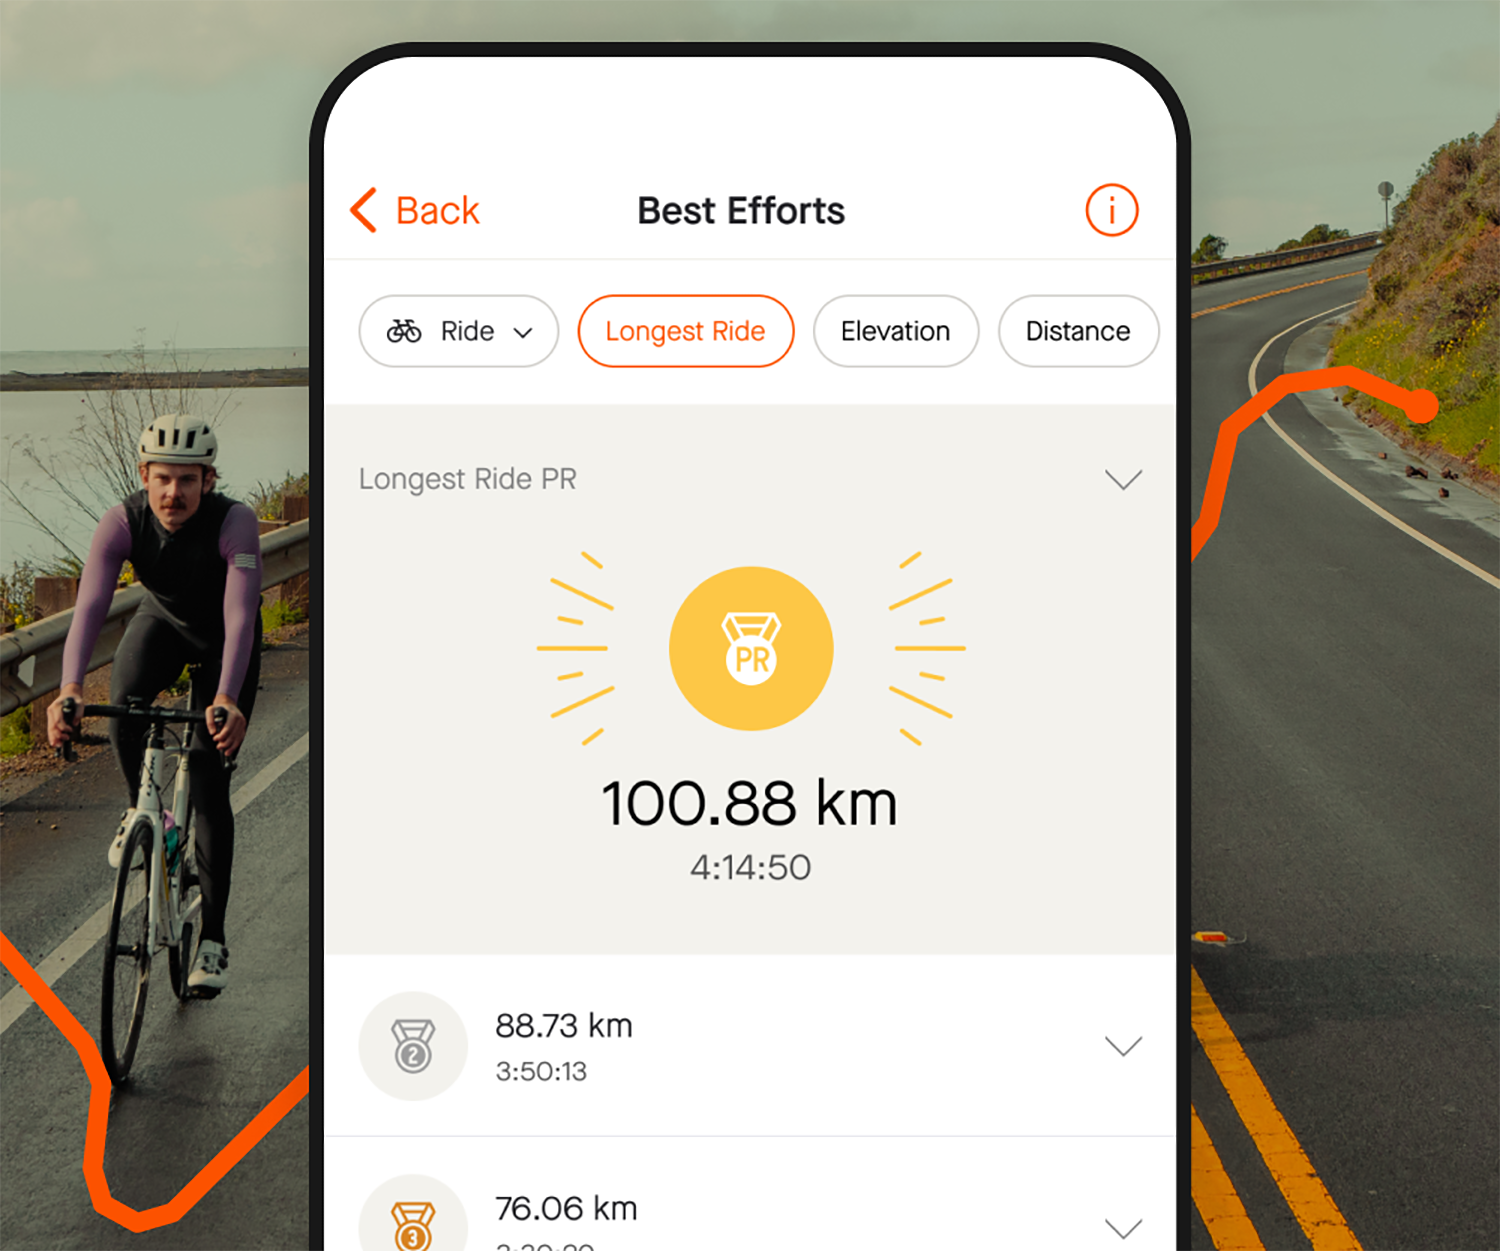

Ride
Just Launched for Cyclists: All-New Best Efforts Categories
77% of cyclists on Strava achieved a PR in 2023 – and 30% got one in the last month. Are you one of them?

Multi-Sport
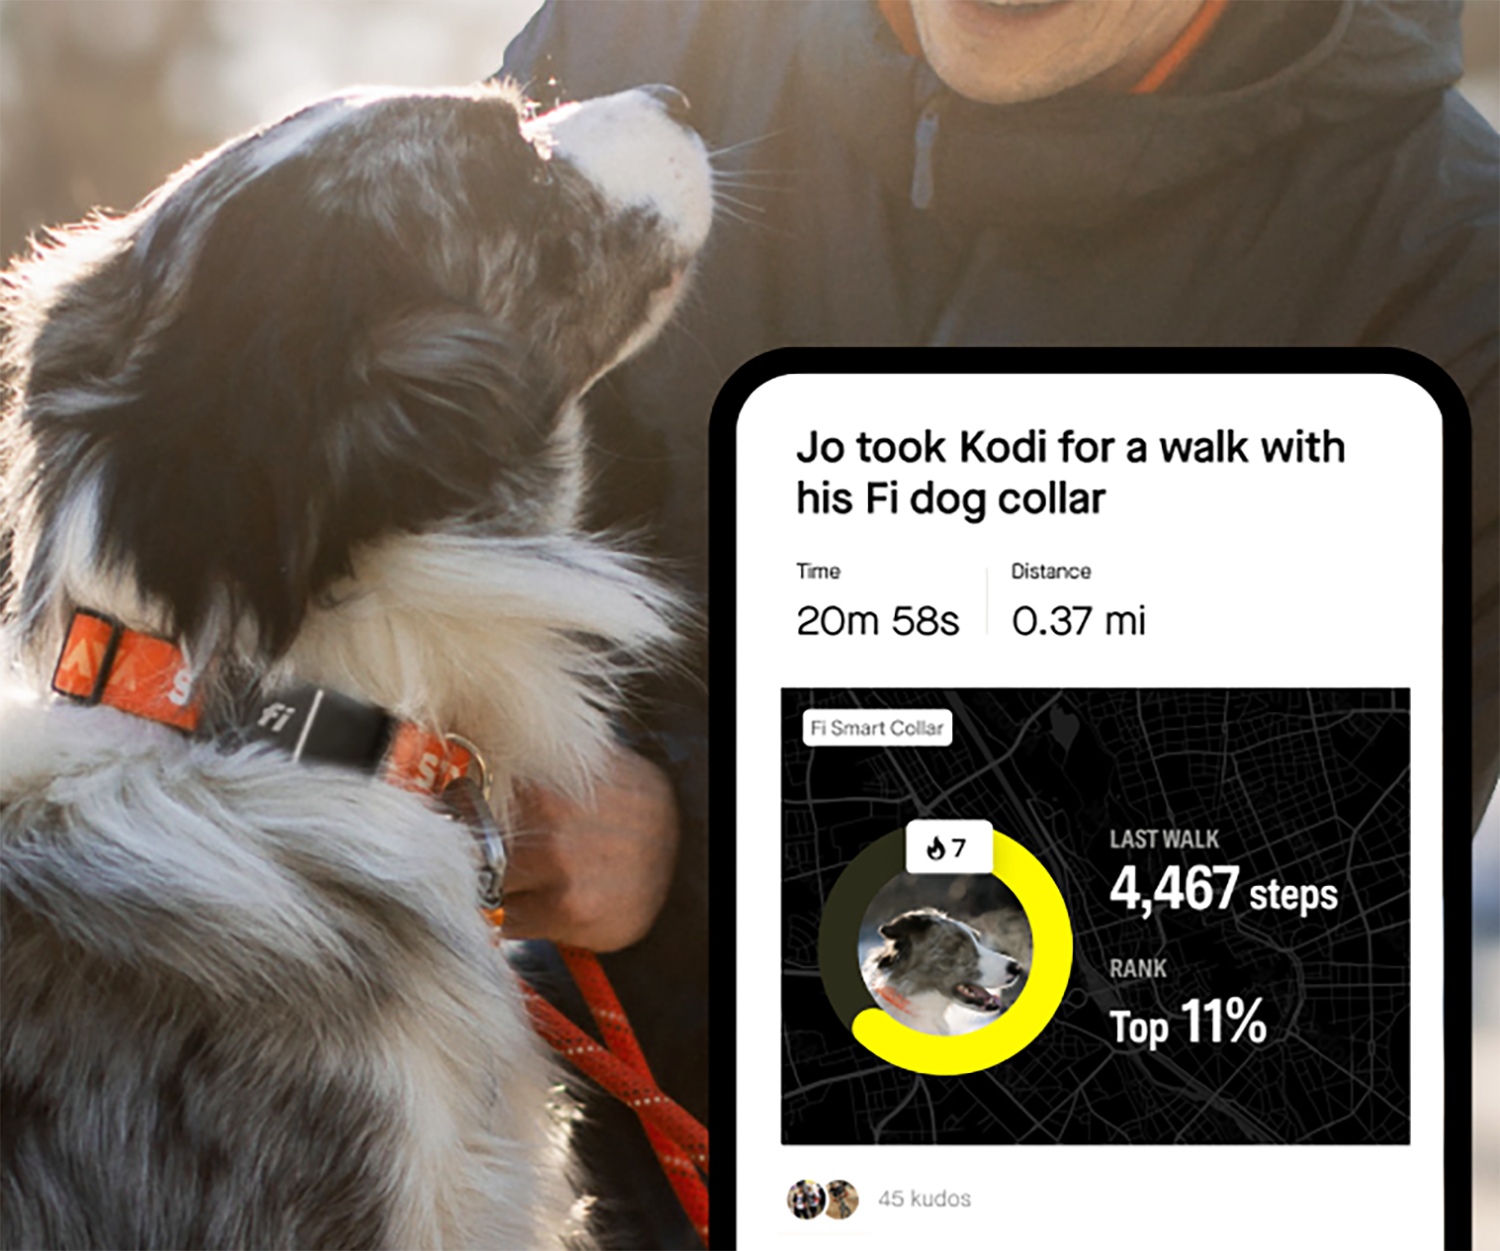
Calling all Dog Parents! 🐶
Strava and the Fi Collar are partnering to give you and your furry friend a fun way to stay motivated and moving.


Multi-Sport
Get a Bird’s-Eye View With Flyover
Capture every mile, every switchback, and every climb with Strava's all-new Flyover feature.
Latest Stories
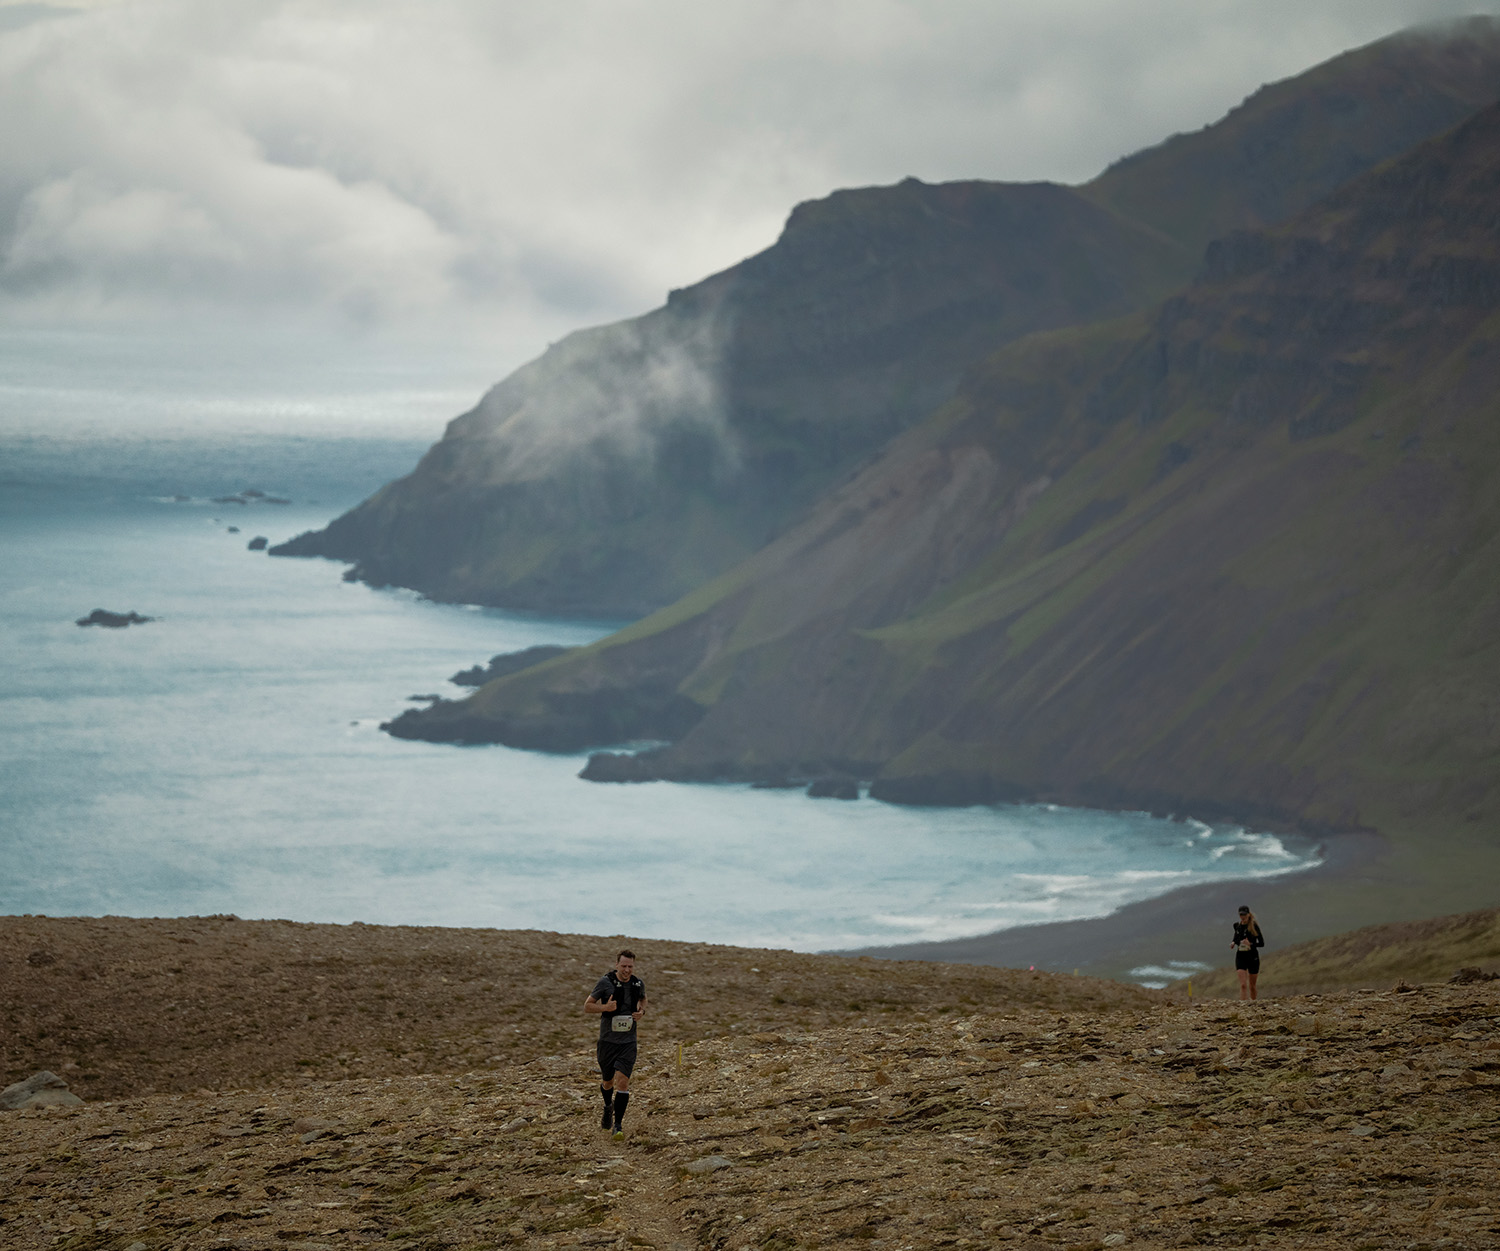
Trail Running
Running Among Giants: Exploring Iceland’s Trail Running Scene
Discover why Iceland stands out as a premier destination for trail running enthusiasts seeking unparalleled challenges, rich culture, and natural beauty.
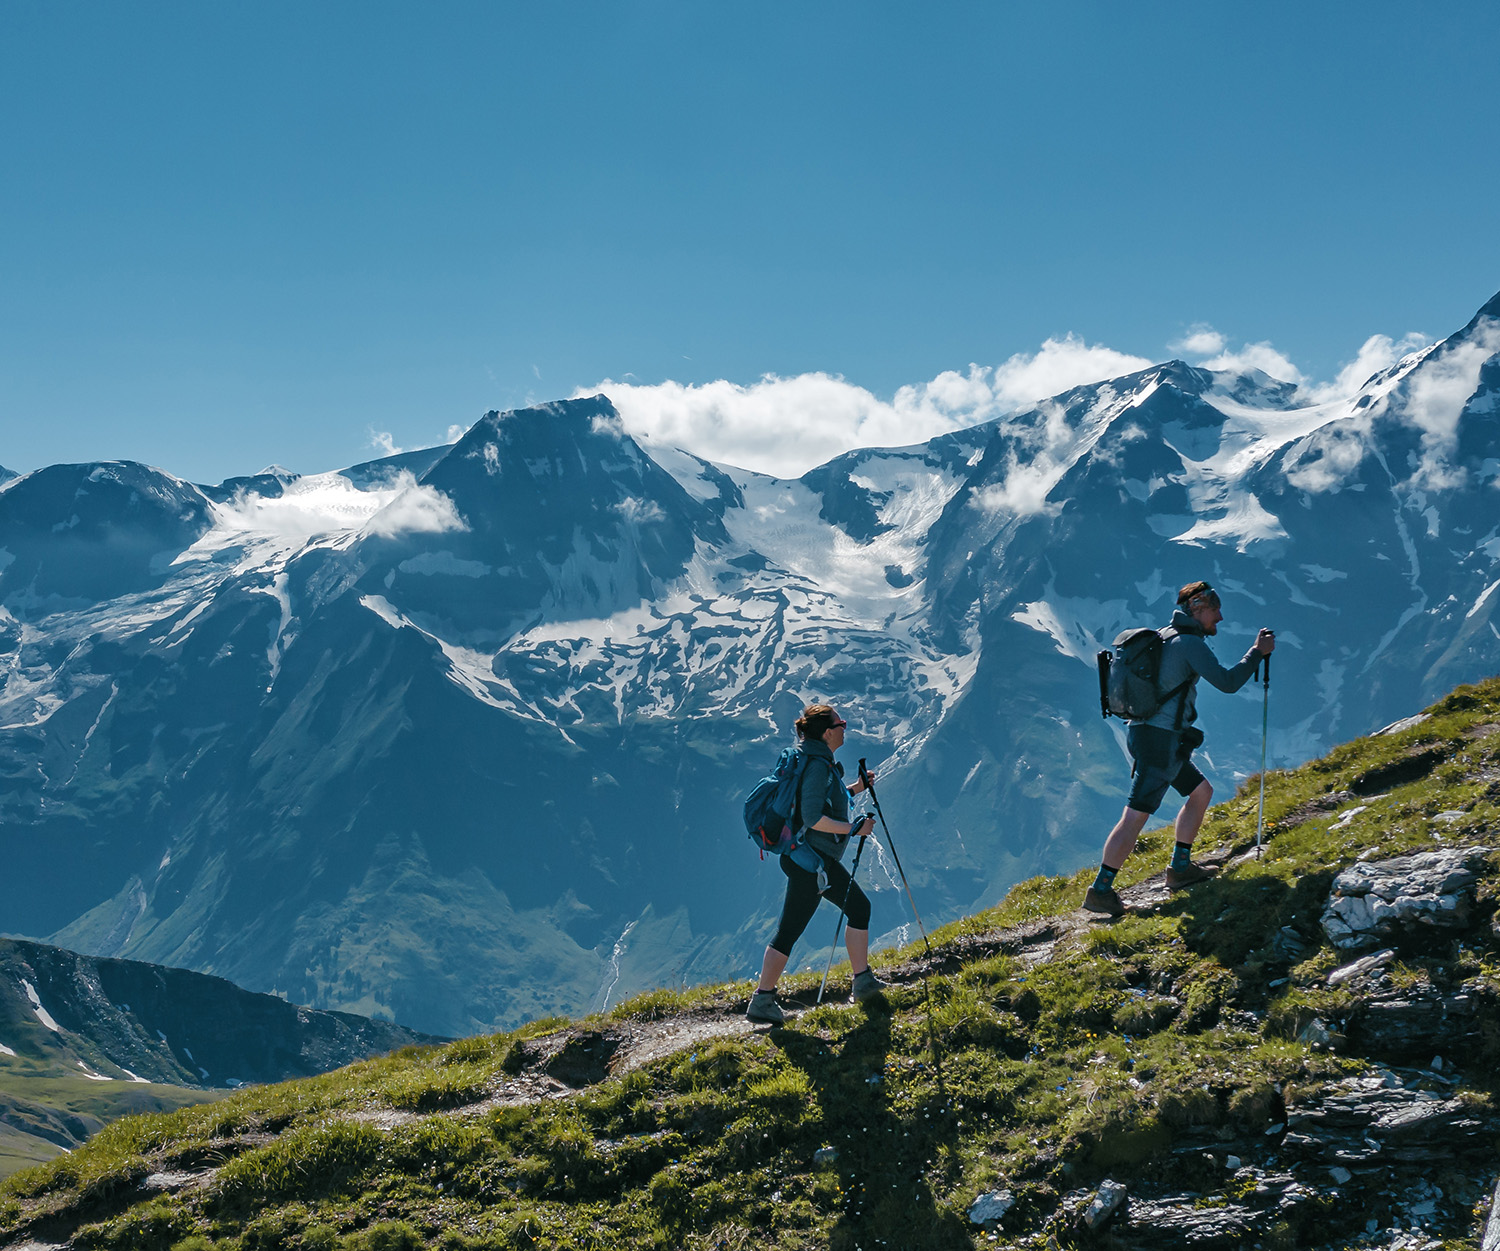
Hiking
The Ten Essentials For Every Outdoor Adventure
Consensus has been reached over the last few decades around “The 10 Essentials” which should go into every backpack every time you venture further afield than the local park. This is the list.

Multi-Sport
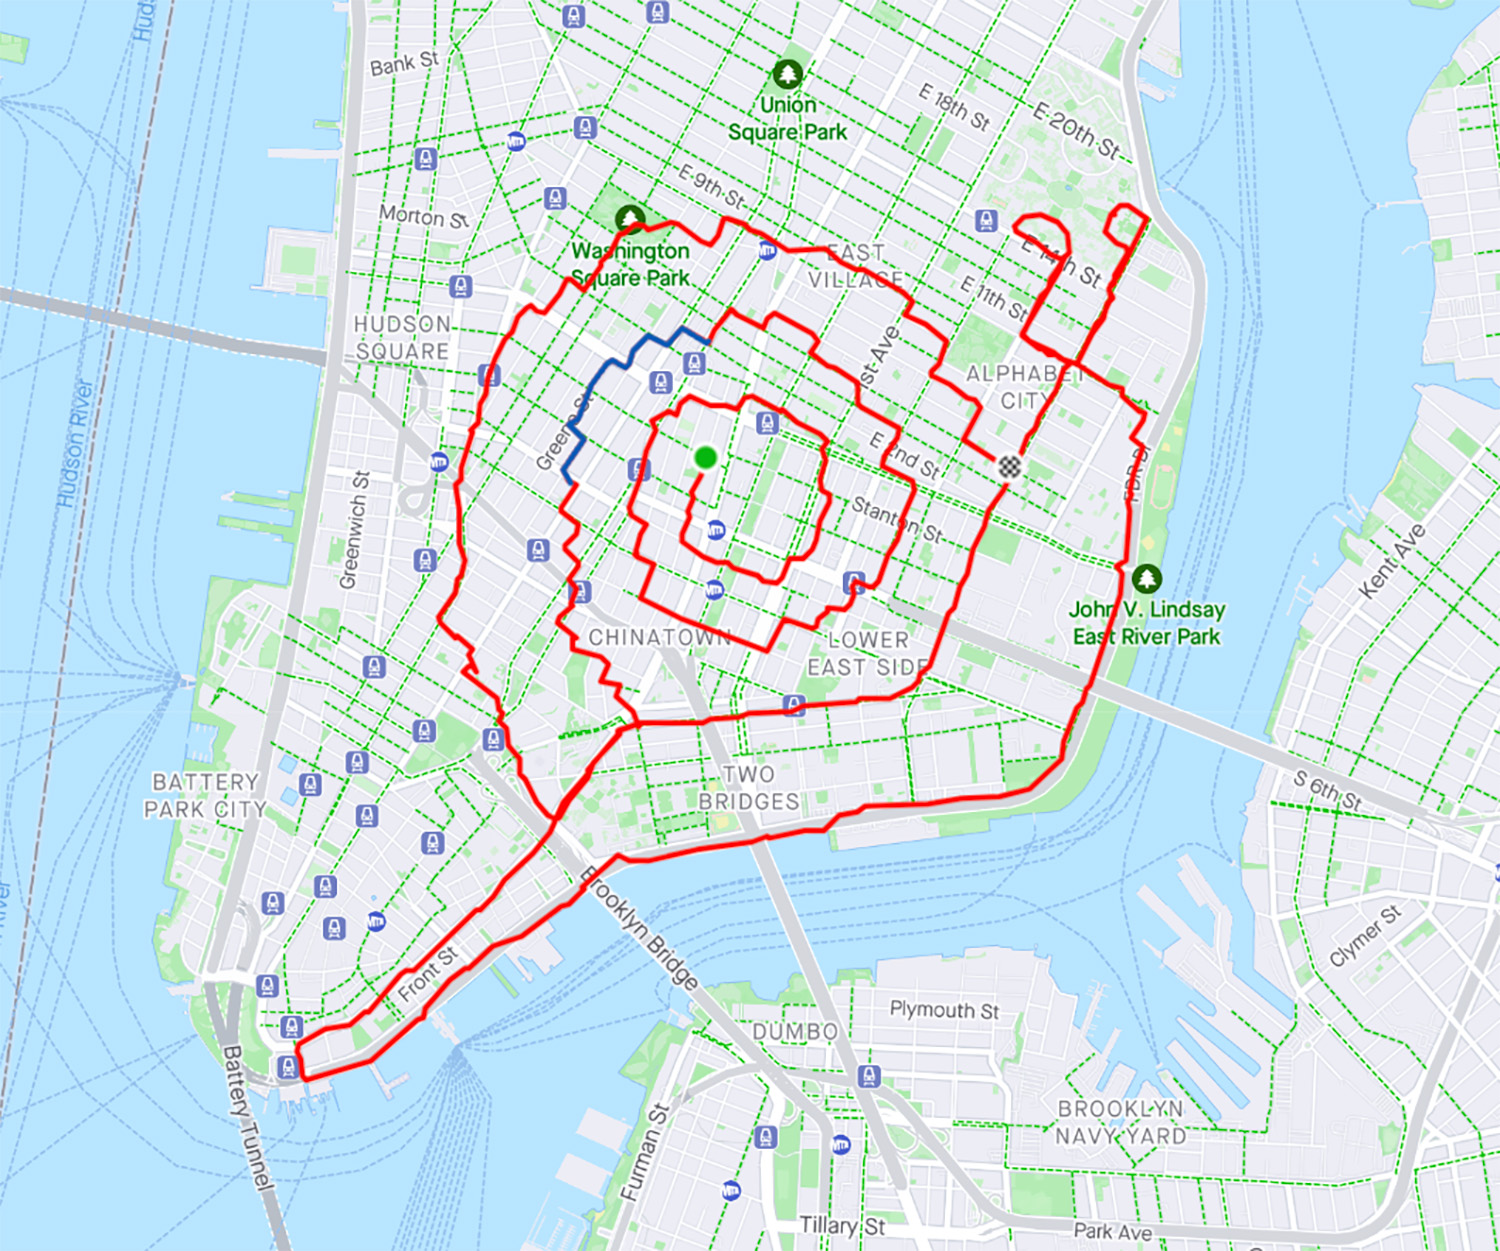
Spotted on Strava: London Marathon, Central Park FKT and... a Snail
From the streets of London, to the California trails by way of NYC, there was plenty going on on Strava this last couple of weeks.
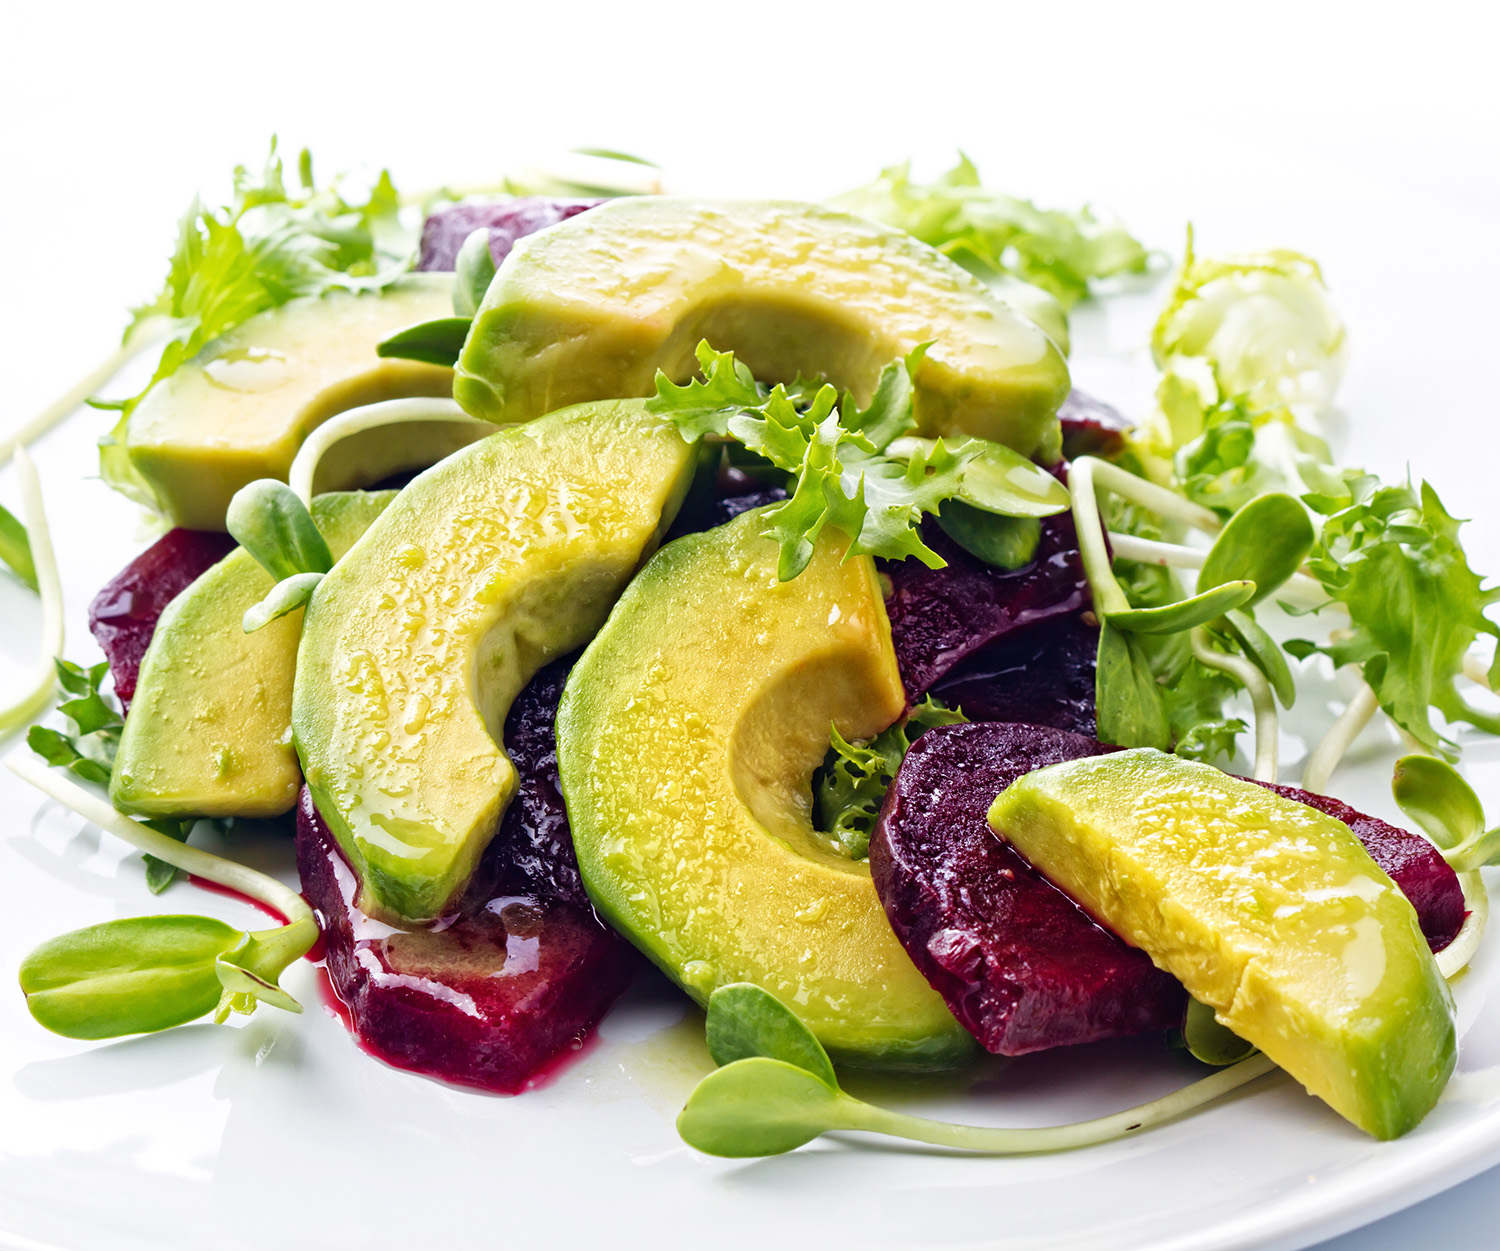
Multi-Sport
The ABCs of Sports Nutrition
Step into the world of nutrition with this ABC series, where we shine a spotlight on ingredients and foods that have captured attention in recent years.
Trail Running
Transgrancanaria Classic: What It’s Like to Run 128km Across Gran Canaria
Ultramarathons used to be a pursuit only a few hardy runners pursued. Not any more. But what is it like to run one? Howard Calvert takes us through the physical and psychological effects of running the Transgrancanaria Classic 128km race.

Multi-Sport
Celebrate Earth Day All Week Long and Help Us Save 500,000kg of CO2
Join Strava Metro in support of EARTHDAY.ORG, and make your commute count by joining the Earth Week: Commute to Curb Carbon Challenge.
Multi-Sport
Mindfulness: The Secret to Becoming a Better, Happier Athlete
When it comes to being a more mindful athlete, there are a few simple strategies that could bring more presence to your training—and life.

Run
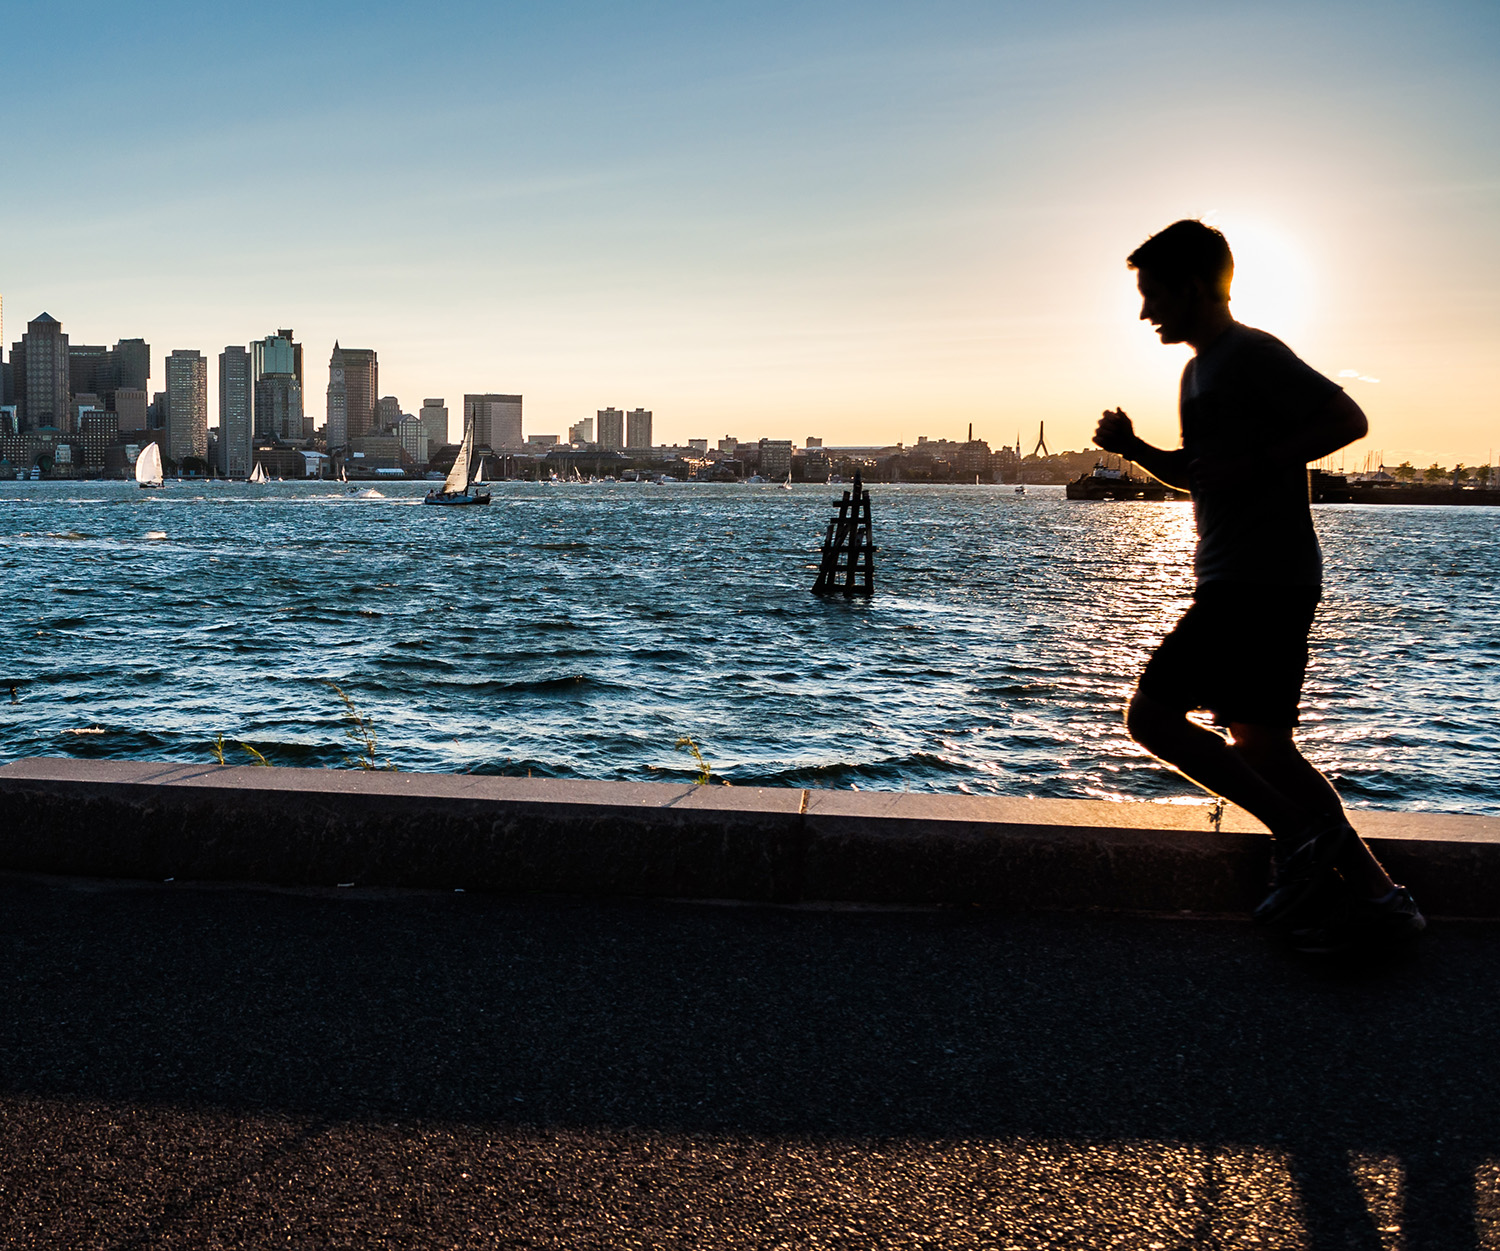
Looking for a Running Crew in Boston? Here Are Some of Our Favorites
Boston’s iconic routes and historic legacy are only part of what makes the city so great for running. There is also a vibrant community of runners and running clubs. Become part of it by joining one of these top running teams in the Boston area.


Run
The London Marathon: The Hidden History Along the Race Route
For 26.2 miles, runners at the London Marathon are surrounded by the long and storied history of the Capital of the United Kingdom. Whether you're running the race, spectating, or watching from home, here are things to look out for.
Multi-Sport
Strava Segments With The Most Efforts: How Many Have You Completed?
Which are the most popular Strava segments in the world? Our experts have analyzed the stats, crunched the numbers, and come up with a list of some of the segments most completed by athletes in different distance categories.
Run
Tight For Time? The Run Sessions To Prioritize
Many athletes increasingly find themselves 'time-crunched', and exercise is often the thing that gets forgotten about. Fortunately, there are sessions you can prioritize and things you can do to help maintain progression when life 'gets in the way'.
Run
Zahra Rose: Inspiring the Next Generation of Muslim Runners
Join Zahra Rose Alazaibi's inspiring journey as she breaks barriers, fosters Muslim representation, and empowers the next generation in the UK's running scene.