Strava Stories


Run
All StoriesMulti-Sport
Popular Strava Segments: How Many Have You Completed?
Which are the most popular Strava segments in the world? Our experts have analyzed the stats, crunched the numbers, and come up with a list of some of the segments most completed by athletes in different distance categories.

Run
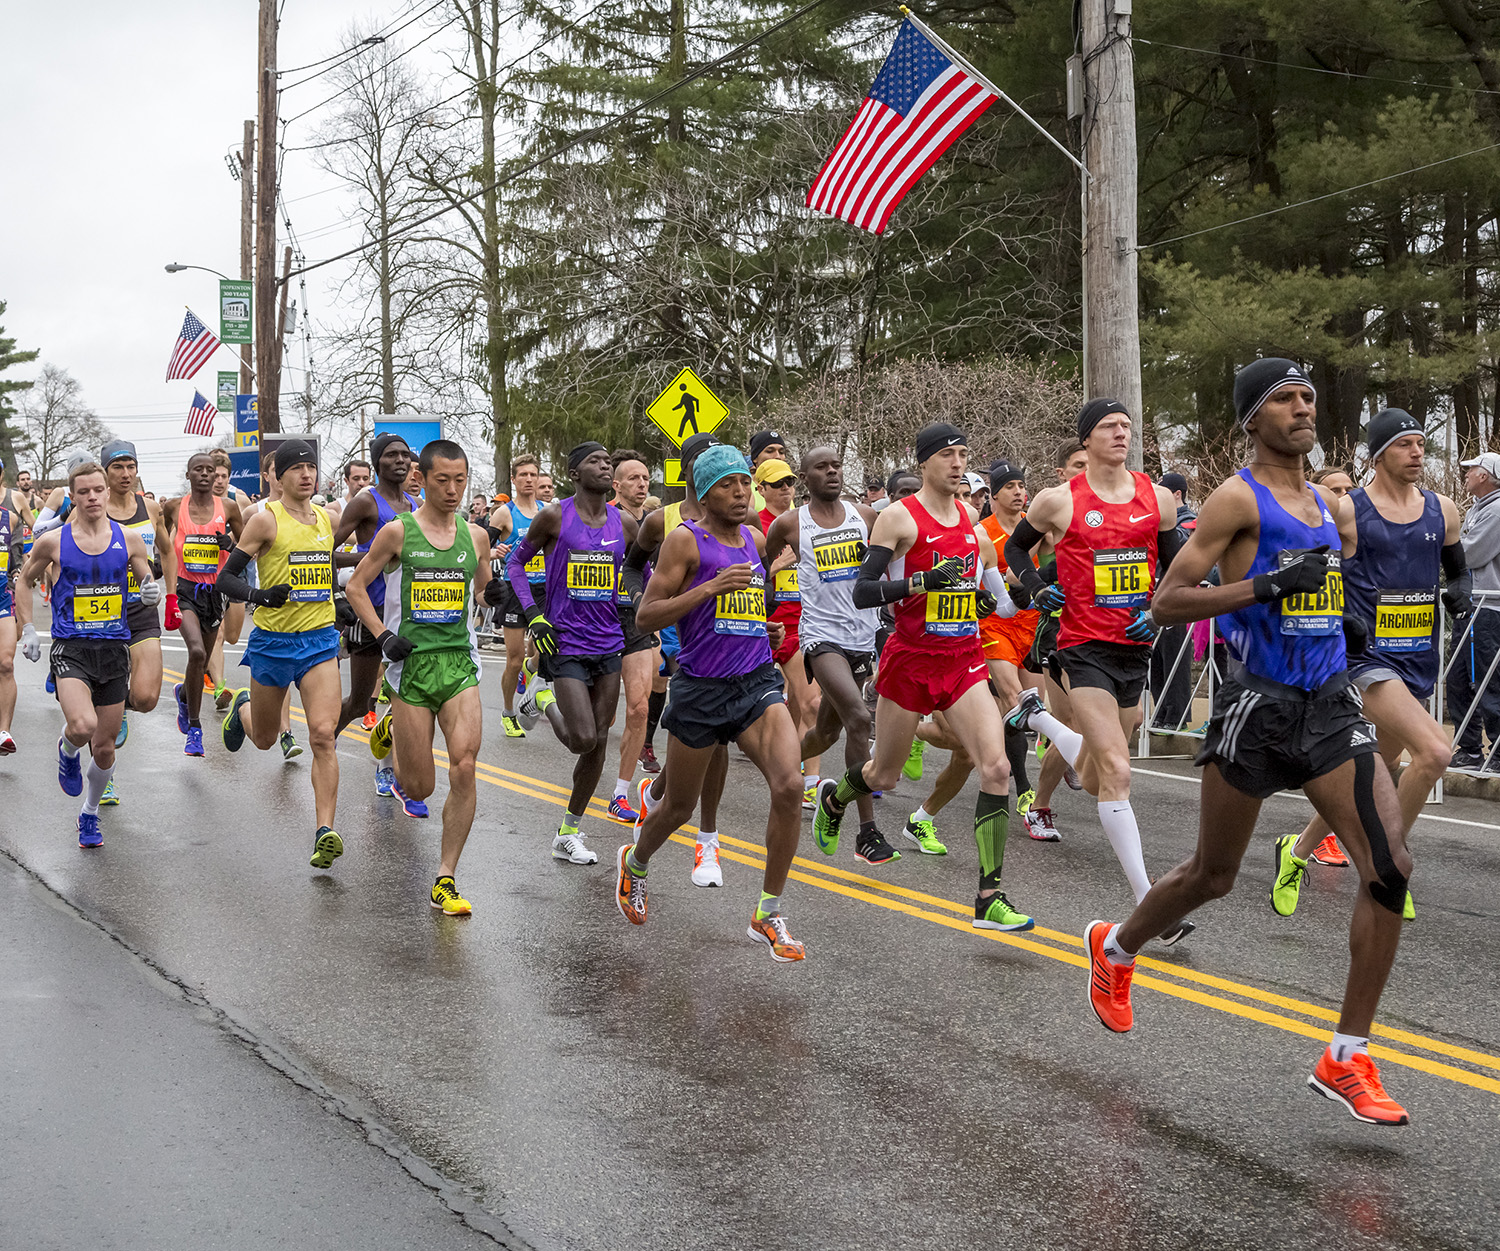
Runners to Follow at Boston Marathon 2024
One of the most revered events on the running calendar, but who to follow at the 2024 Boston Marathon. This is our list of Strava Athletes you will want to be sharing the kudos with.
Run
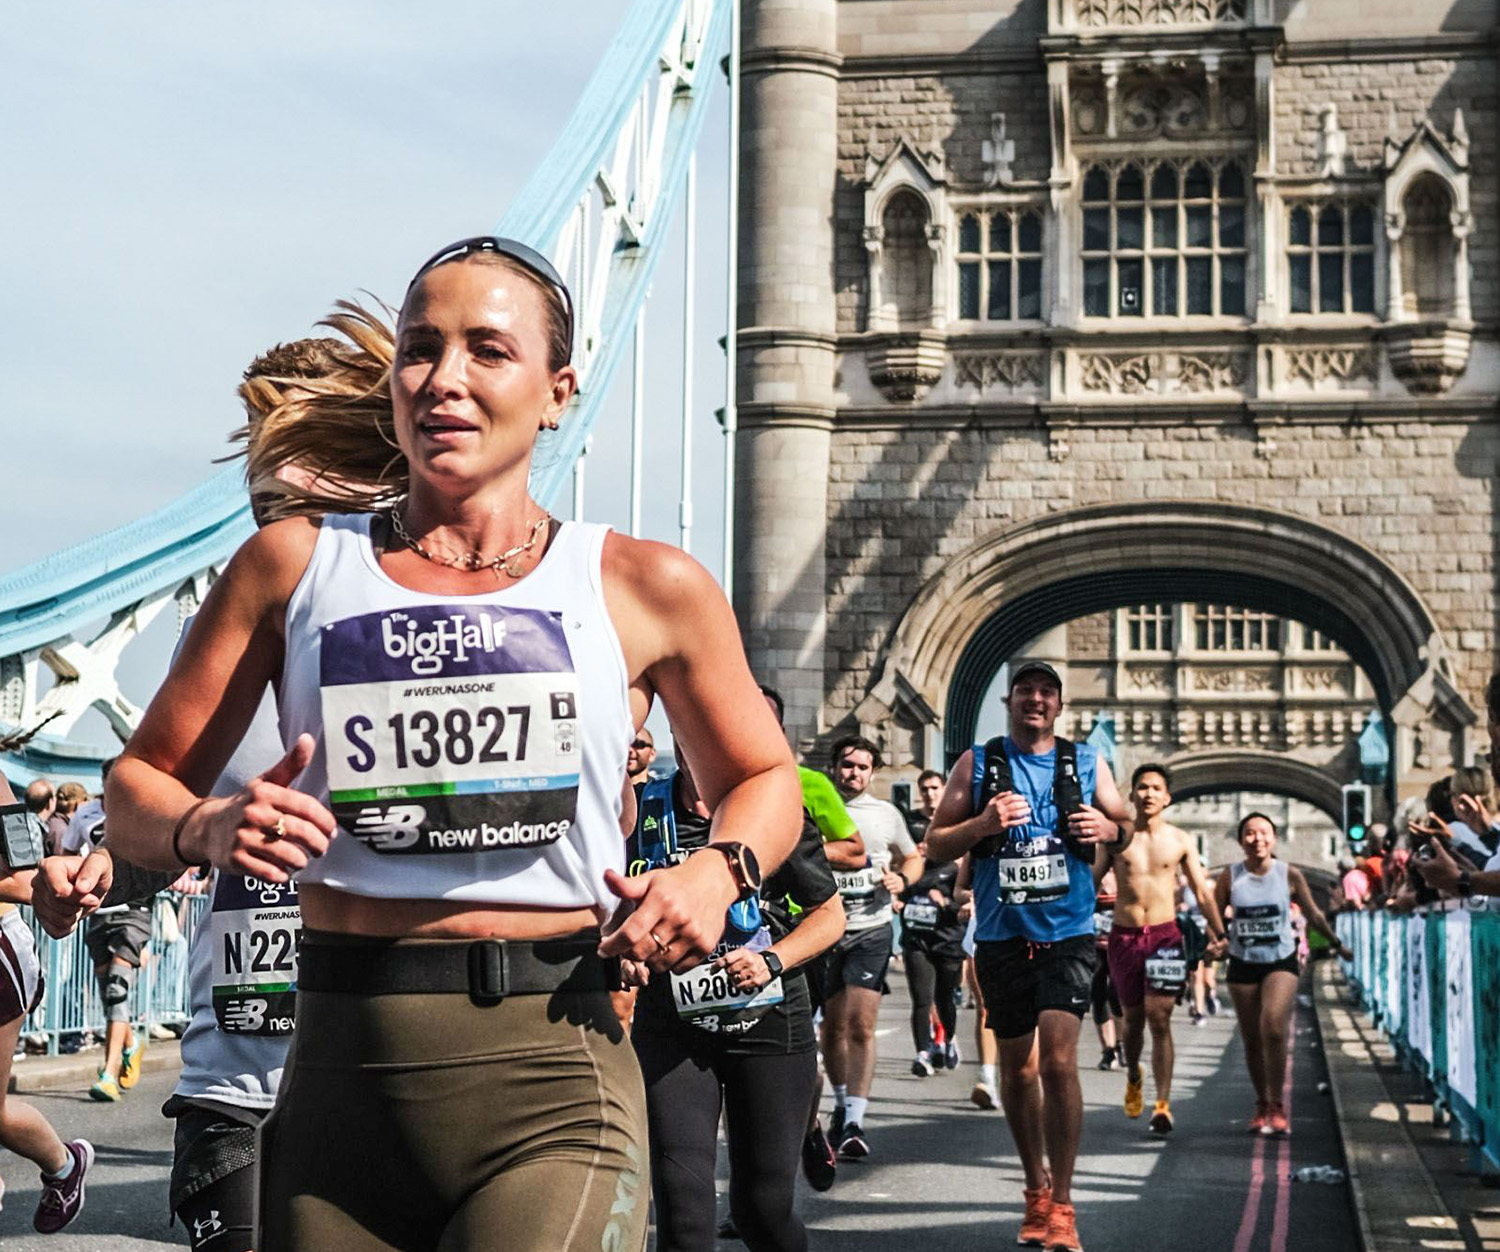
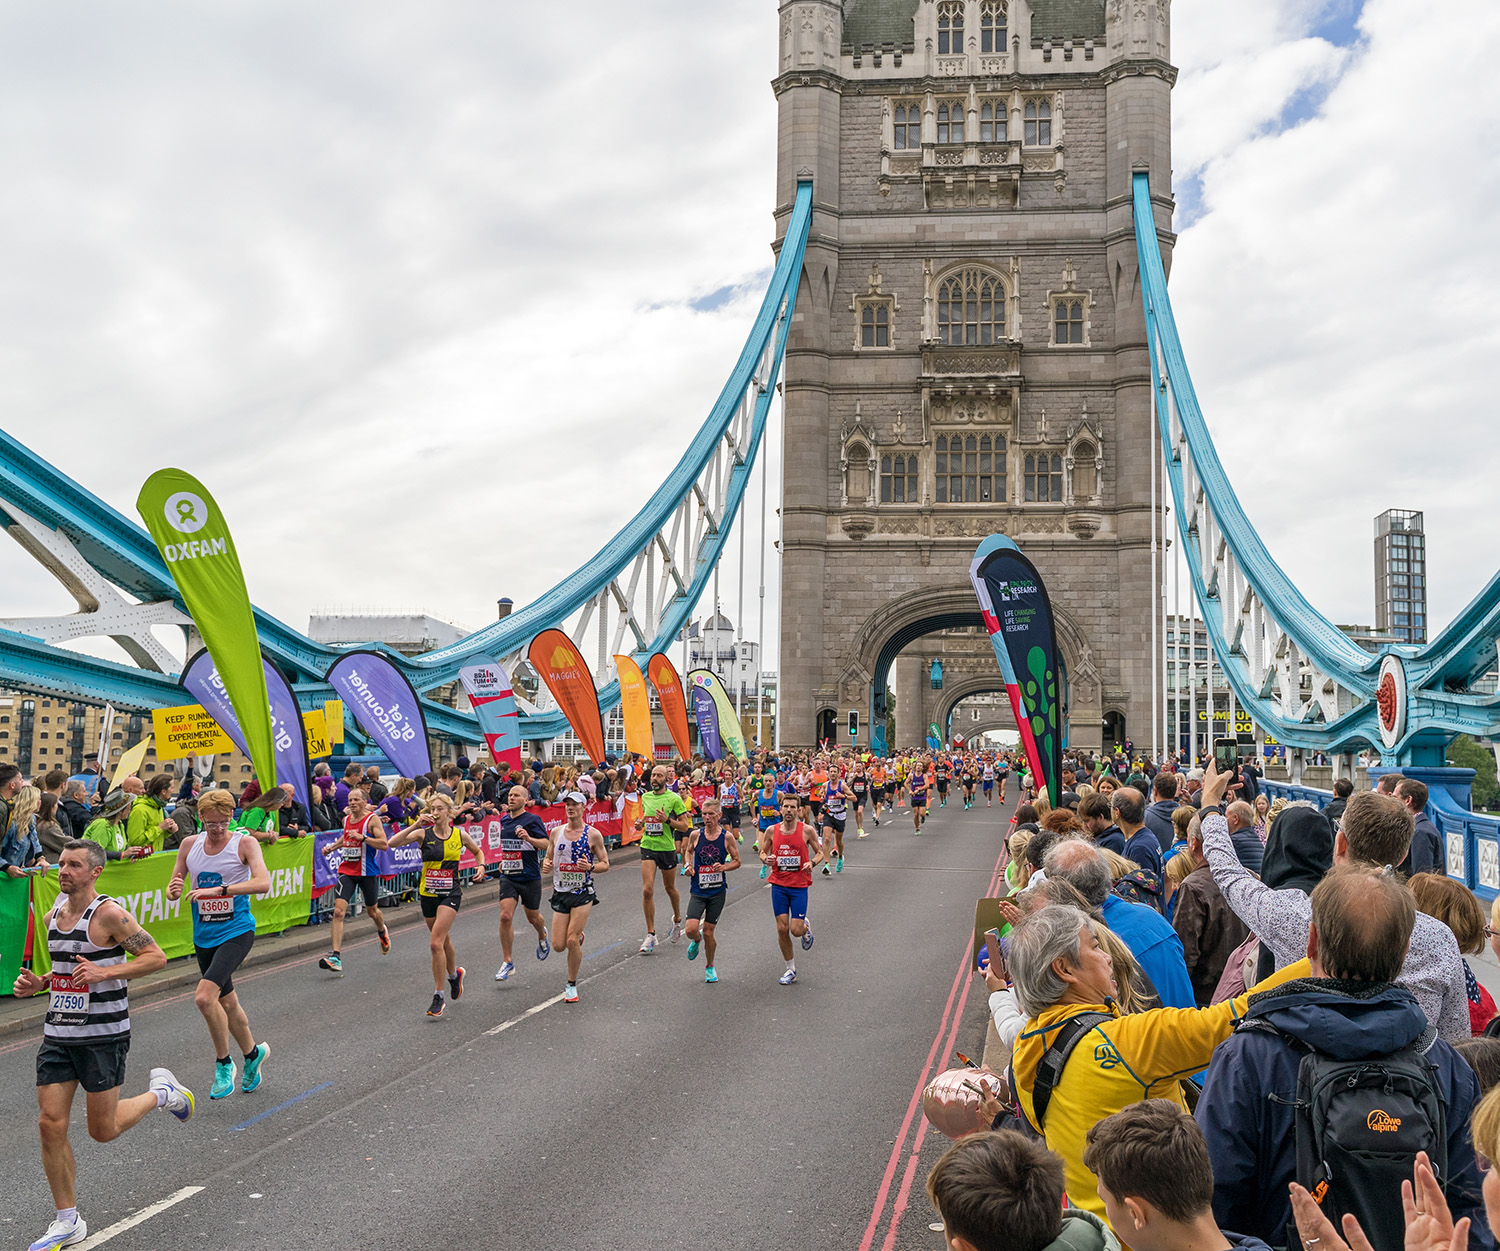
The London Marathon: The Hidden History Along the Race Route
For 26.2 miles, runners at the London Marathon are surrounded by the long and storied history of the Capital of the United Kingdom. Whether you're running the race, spectating, or watching from home, here are things to look out for.
Ride
All StoriesRide
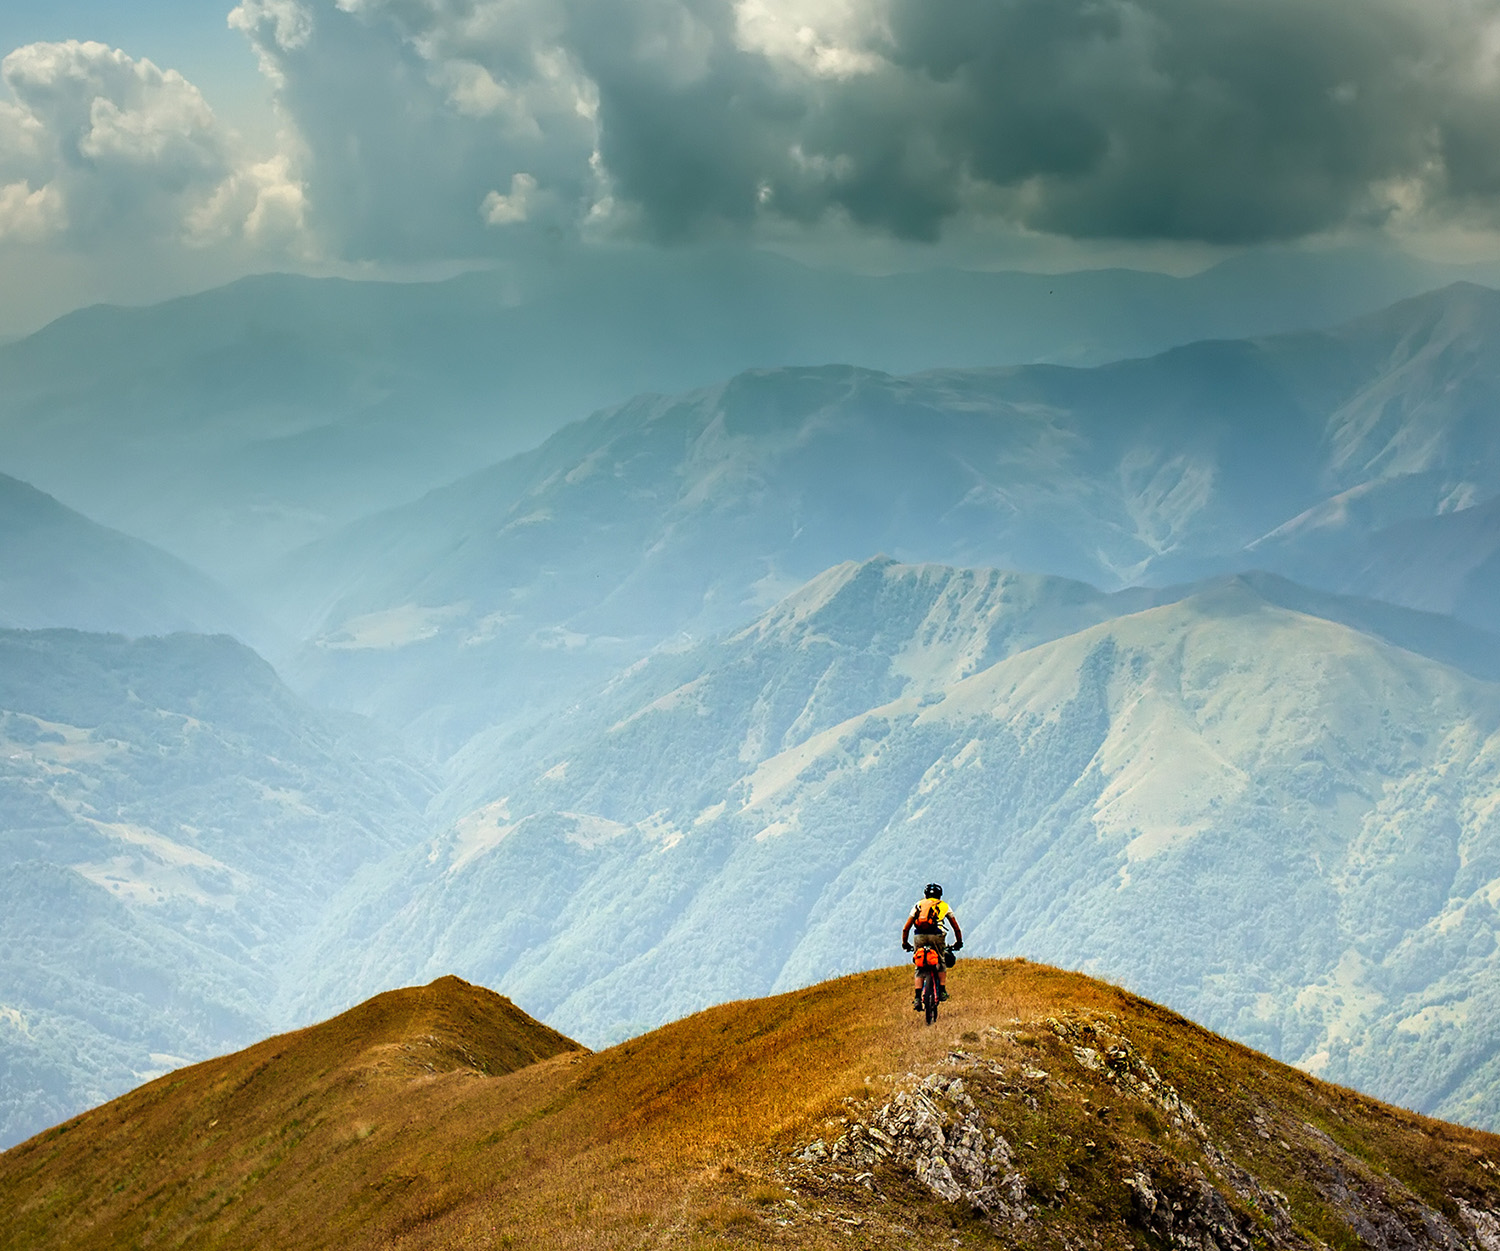
Adventures of a Lifetime: The World’s Most Challenging Off-Road Bikepacking Races
The number of grueling multi-day off-road races has skyrocketed in recent years. We highlight some of the most adventurous, most challenging events in the world.


Ride
Roadie, MTB… Both?! Don’t Let a Tribal Mindset Limit Your Cycling
Cycling can often be a tribal activity. But if cyclists like roadies and MTBers can put their differences aside, moving between disciplines can have real benefits for everyone who enjoys being on two wheels.


Multi-Sport
Strava Routes and Heatmap: Find New Places to Go
Whether you’re visiting somewhere new or simply bored of your regular routes, Strava can provide you with a little mapping inspiration.
From Our Partners
All StoriesSTRAVA | JOIN Cycling

Ride
How Pro Cyclists' Lives Have Gotten More Complex in the Last 10 Years
Over the past 10 years, the lives of professional cyclists have gotten dramatically more complex... and that's not always a bad thing, argues Jim van den Berg.
Paid Partnership
STRAVA | Brooks

Run
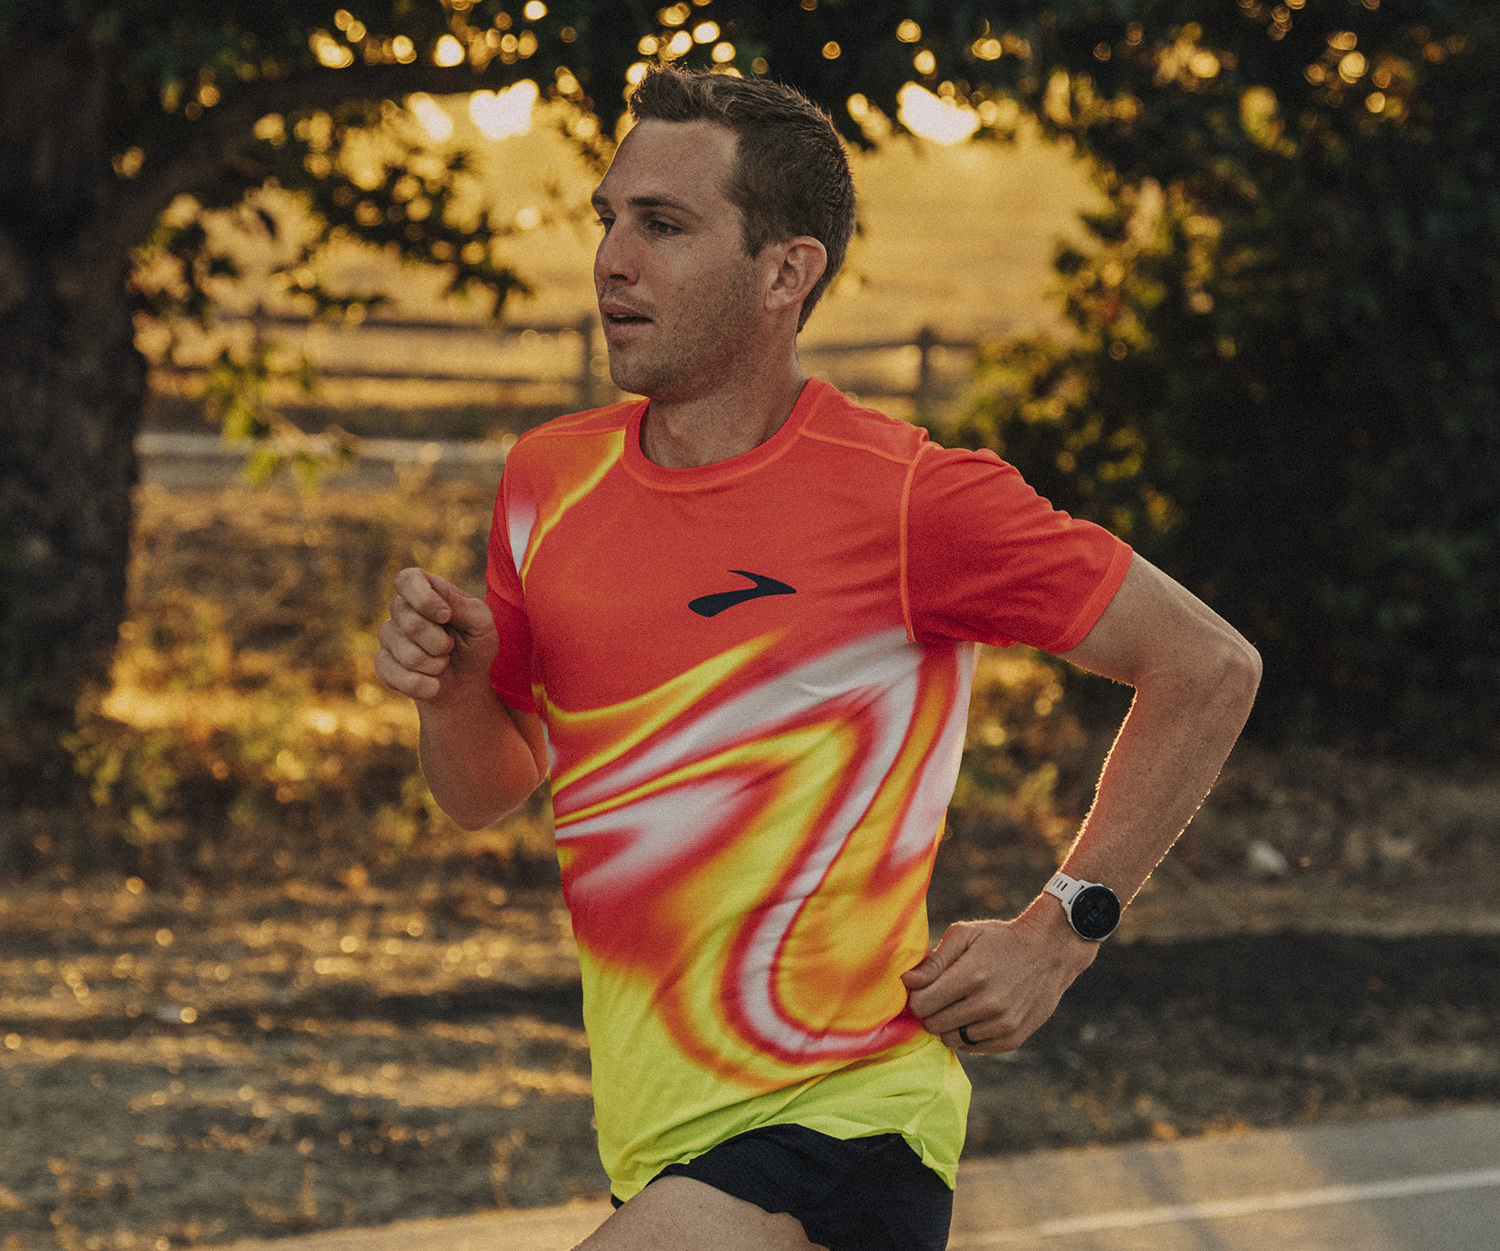
CJ Albertson: A 2:10 Pro Marathoner’s Unique Coaching Tips
Meet CJ Albertson – 2:10:07 pro marathoner for Brooks Running, dad of two, running coach extraordinaire, and master of the quirkiest marathon training methods.
Paid Partnership
STRAVA | JOIN Cycling


Ride
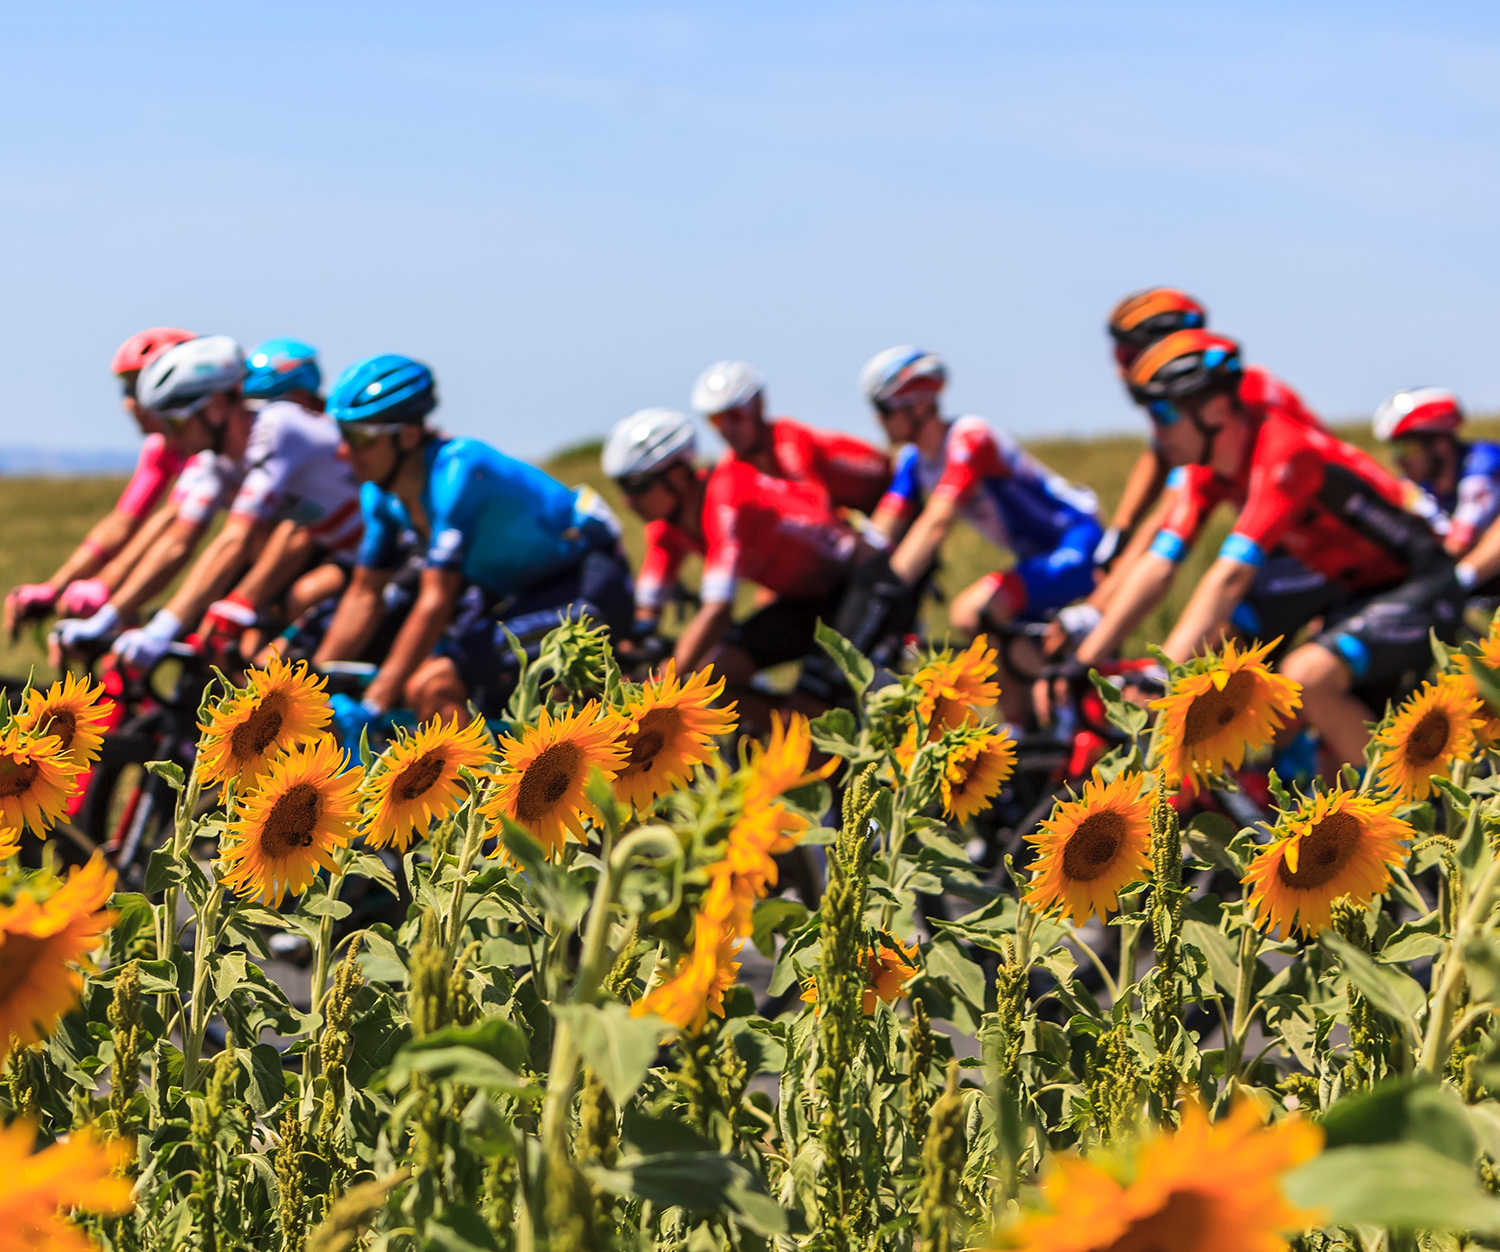
It's All About the Basics: 4 Lessons Amateurs Can Learn from a World Tour Cyclist's Training
From getting enough training volume in to eating enough while on the bike, here are four lessons that amateur cyclists can learn from World Tour pros.
Paid Partnership
Training
All Stories

More Sports
The Secrets to Creating a Successful Training Program
It can be difficult to figure out which training program is for you, so in this article, Charlie gives some basic, common-sense rules to apply when trying to make sense of all the noise.


Multi-Sport
How To Stay Fit While Traveling
Charlie shares a host of useful tools and tactics that you can use to stay in shape while traveling.


Ride
Low Risk, High Reward: The Polarized Training Method for Cyclists
Can you make significant performance and fitness gains with just three types of rides? The science says yes.
What's New
All Stories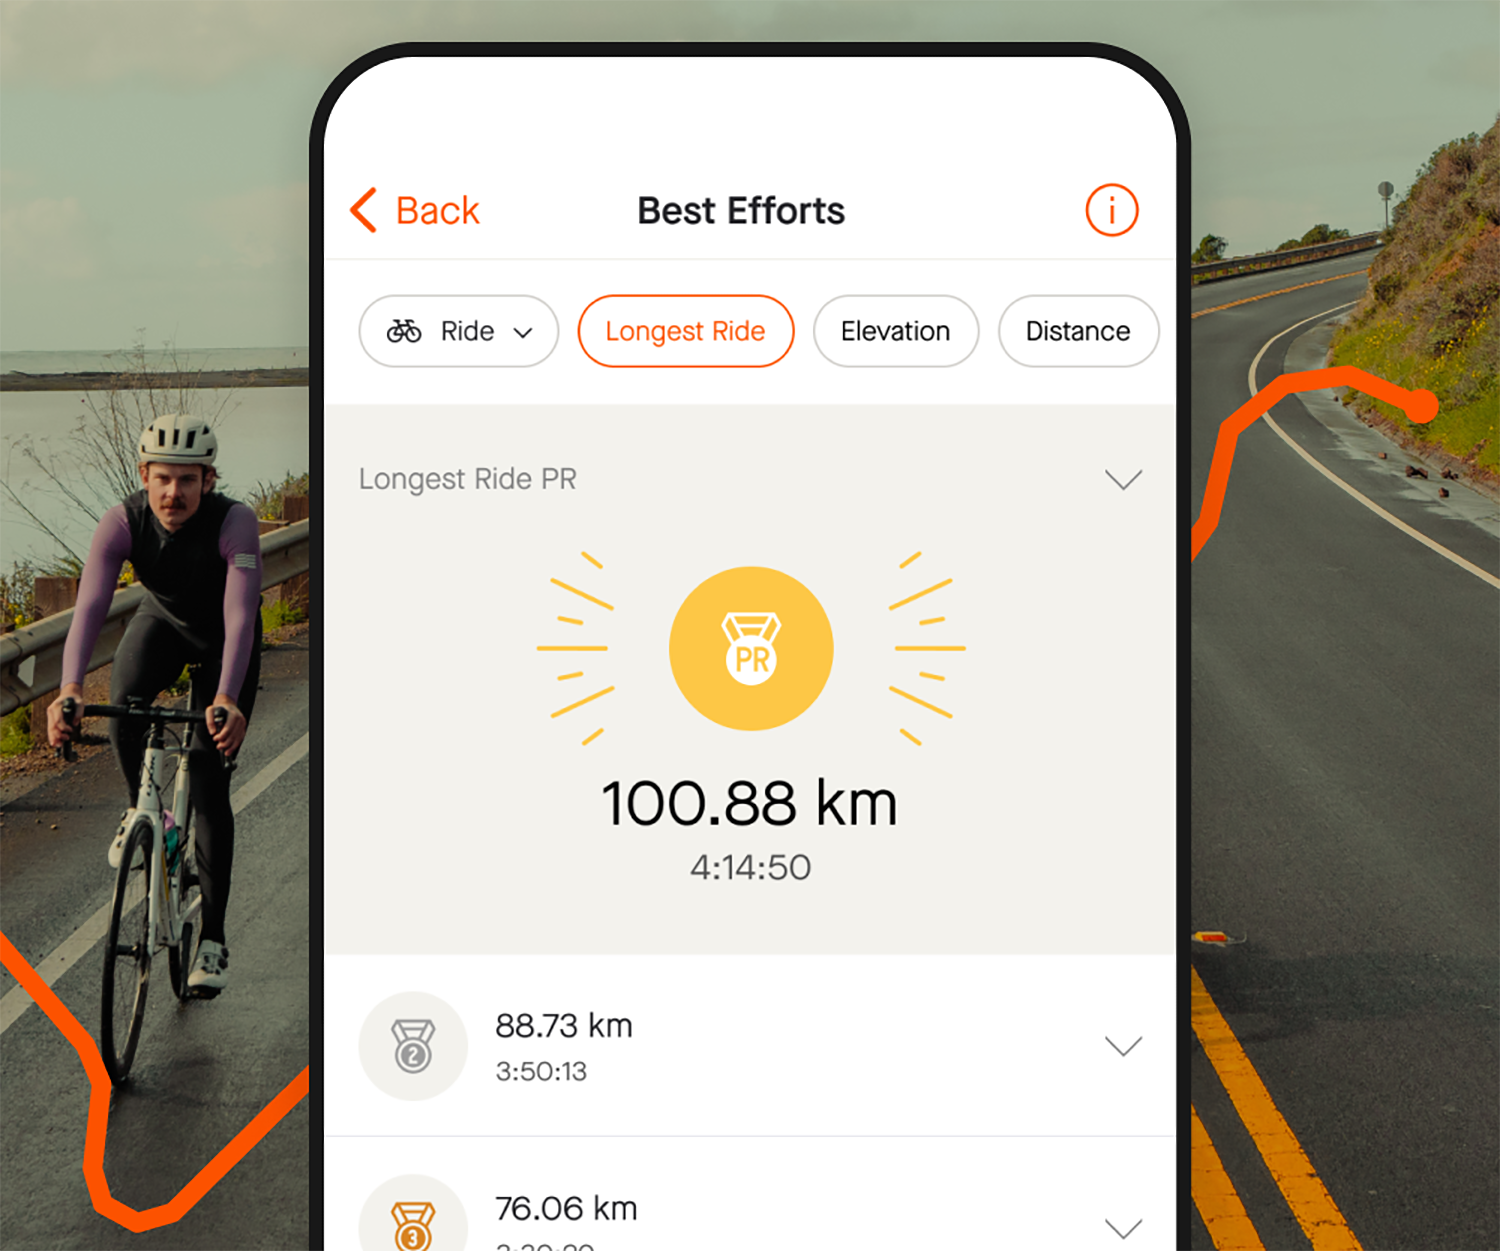

Ride
Just Launched for Cyclists: All-New Best Efforts Categories
77% of cyclists on Strava achieved a PR in 2023 – and 30% got one in the last month. Are you one of them?


Multi-Sport
Calling all Dog Parents! 🐶
Strava and the Fi Collar are partnering to give you and your furry friend a fun way to stay motivated and moving.


Multi-Sport
Get a Bird’s-Eye View With Flyover
Capture every mile, every switchback, and every climb with Strava's all-new Flyover feature.
Latest Stories
Run
The London Marathon: The Hidden History Along the Race Route
For 26.2 miles, runners at the London Marathon are surrounded by the long and storied history of the Capital of the United Kingdom. Whether you're running the race, spectating, or watching from home, here are things to look out for.
Multi-Sport
Popular Strava Segments: How Many Have You Completed?
Which are the most popular Strava segments in the world? Our experts have analyzed the stats, crunched the numbers, and come up with a list of some of the segments most completed by athletes in different distance categories.
Run
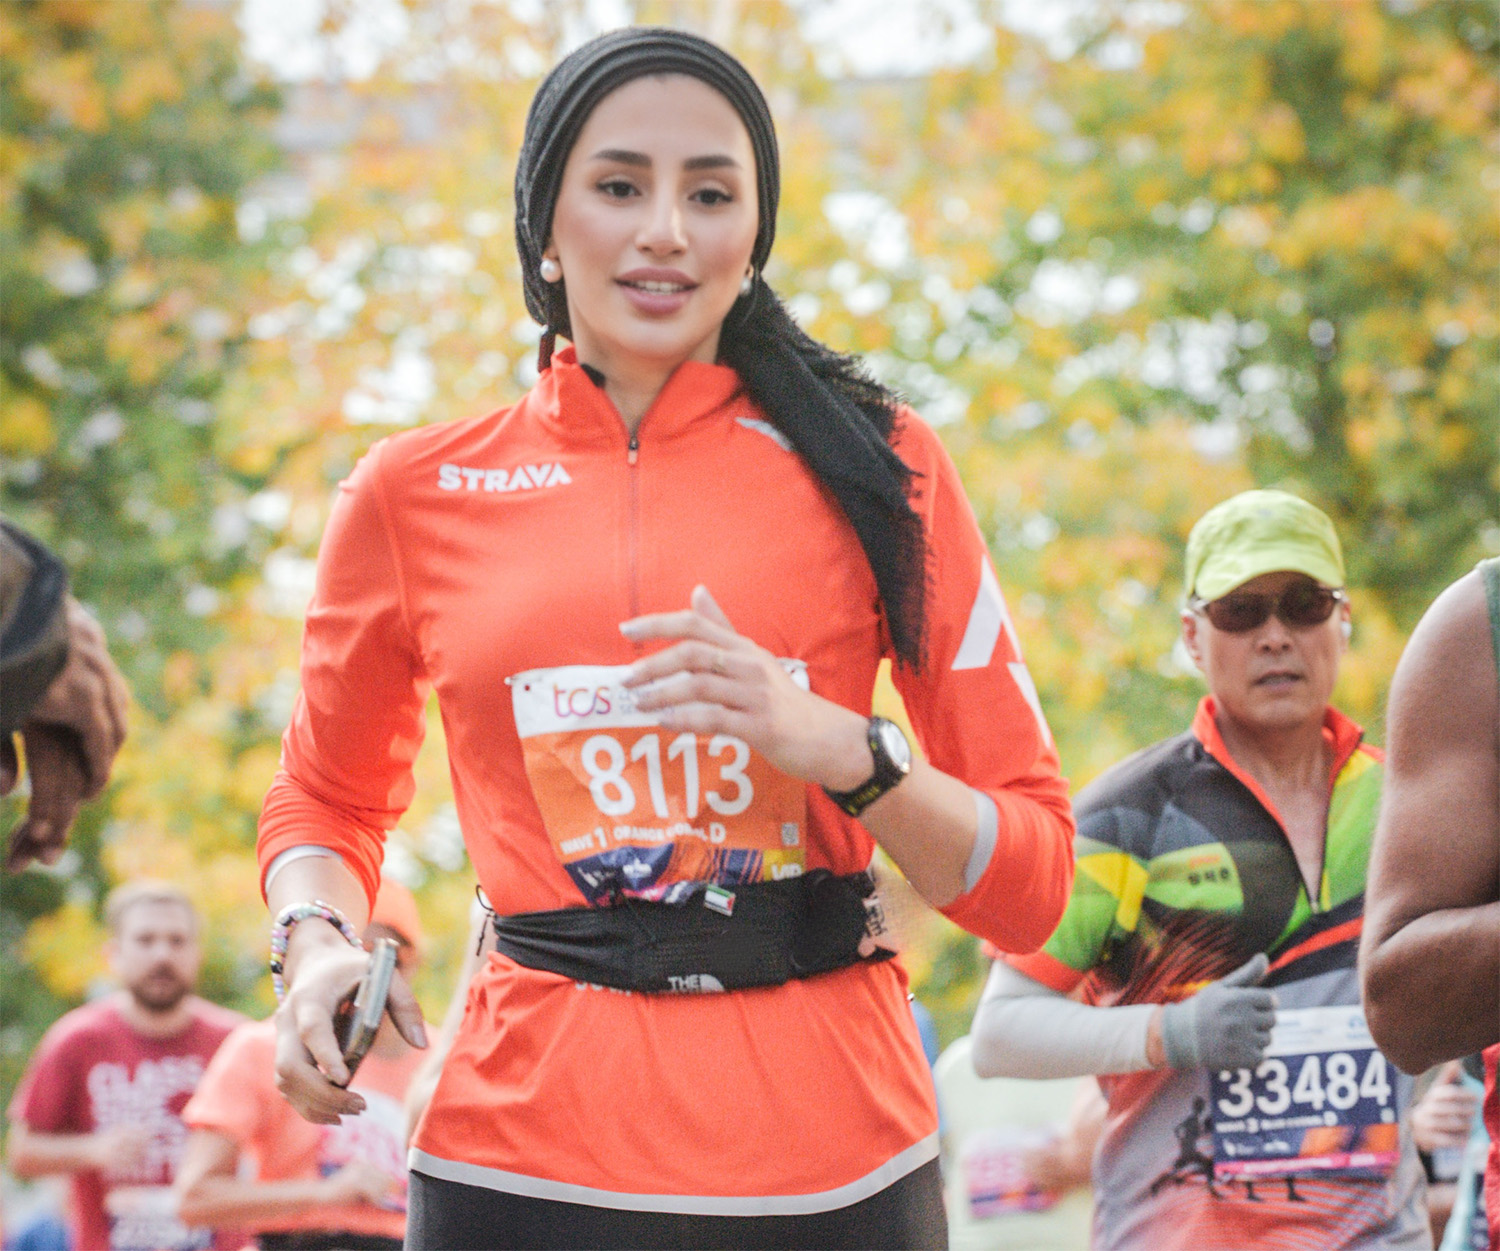
Zahra Rose: Inspiring the Next Generation of Muslim Runners
Join Zahra Rose Alazaibi's inspiring journey as she breaks barriers, fosters Muslim representation, and empowers the next generation in the UK's running scene.
Ride
Adventures of a Lifetime: The World’s Most Challenging Off-Road Bikepacking Races
The number of grueling multi-day off-road races has skyrocketed in recent years. We highlight some of the most adventurous, most challenging events in the world.
Run
‘Running Saved my Life’: Sophie Grace Holmes on Living with Cystic Fibrosis
Sophie Grace Holmes defies Cystic Fibrosis as an ultra-endurance athlete. Here, she shares how living each day to the fullest fuels both her sporting success and her passion for life.


Trail Running
9 Legendary 100-Mile Ultramarathon Races
Running can be an addictive sport. One minute you're tackling your first 5K, the next you're wondering just how far you can go...
Run
Runners to Follow at London Marathon 2024
One of the great marathon events of the year, the London Marathon attracts more than 54,000 runners from around the world. But who should you follow?


Multi-Sport
How To Maintain Your Training Consistency When Life 'Gets In The Way'
Whatever our exercise intentions, life can often ‘get in the way’ of them. However, there are some simple things you can do to help manage your mind - and your body - to stay motivated and consistent in your training.
Run
Runners to Follow at Boston Marathon 2024
One of the most revered events on the running calendar, but who to follow at the 2024 Boston Marathon. This is our list of Strava Athletes you will want to be sharing the kudos with.

Strava Updates
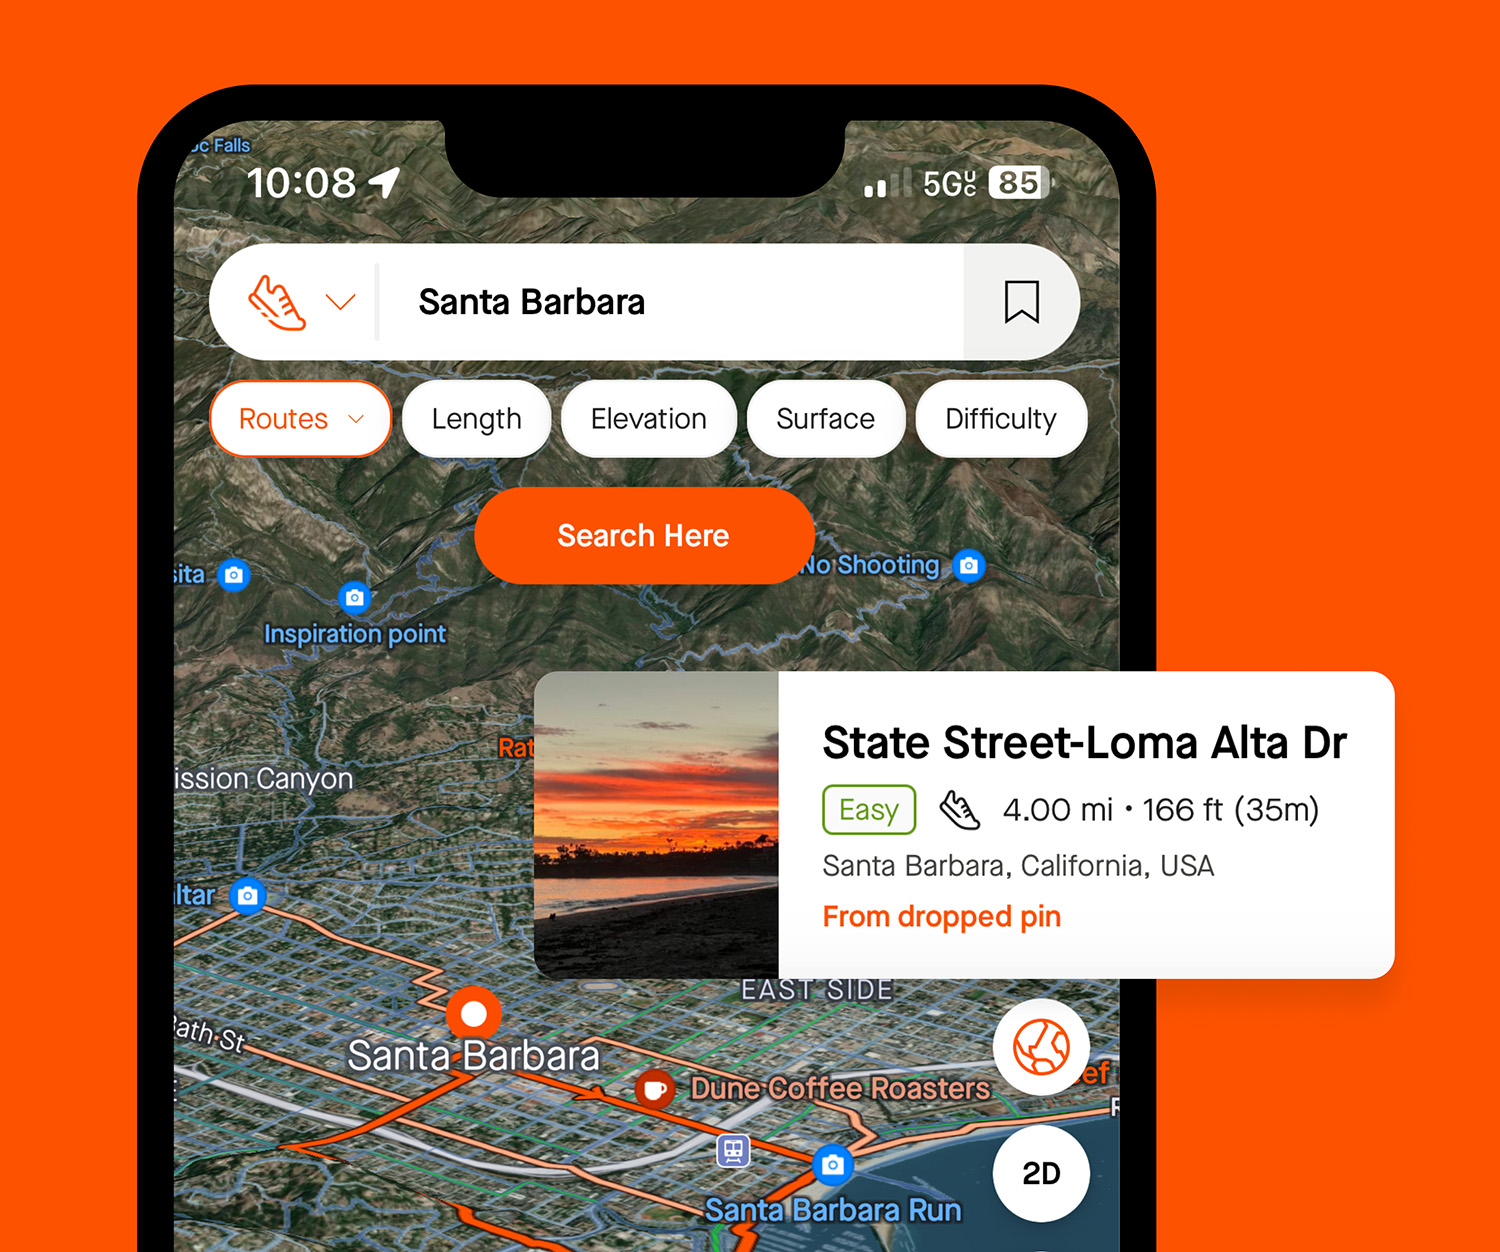
It Just Got Easier To Plan A Route With Strava Maps
With the new-look Strava maps, it’s a lot – and we mean a lot – easier for subscribers to get and use a new route custom-built for you.
Ride
Roadie, MTB… Both?! Don’t Let a Tribal Mindset Limit Your Cycling
Cycling can often be a tribal activity. But if cyclists like roadies and MTBers can put their differences aside, moving between disciplines can have real benefits for everyone who enjoys being on two wheels.


Multi-Sport
Nutrition Strategies: Making or Breaking Your Race
Nutrition can make or break a race, especially in endurance events. But while most athletes see nutrition through the lens of fuel or recovery, it is also an integral part of optimizing your performance.